AWS Cloud Operations & Migrations Blog
Visual monitoring of applications with Amazon CloudWatch Synthetics
Monitoring application endpoints is a reliable way to measure availability. This best practice can be extended by adding synthetic monitoring to your observability strategy. Synthetic monitoring lets you continually verify your customers’ experience by following the same routes and actions as your customers. You can create scripts or canaries that monitor things such as availability, page load times, broken links, etc. in your application. However, these custom scripts increase your operational overhead in developing and maintaining them. Furthermore, these scripts might not be able to identify visual defects that could affect end-user experience.
With the launch of visual monitoring support by Amazon CloudWatch Synthetics, you can measure visual differences in your application and identify defects before they impact your users. Utilizing visual monitoring lets you detect visual defects in your application by comparing screenshots with an established baseline, adjust thresholds for variance, ignore selected page sections, and more. This post will walk through how the visual monitoring blueprint for Amazon CloudWatch Synthetics can be utilized to monitor your applications for visual defects.
Creating canaries with the visual monitoring blueprint
Based on your needs, you can create and run canaries with your own scripts via CloudWatch Synthetics. However, the blueprints available will help you get started quickly, and they are available for various use-cases. I will walk through creating a canary using the visual monitoring blueprint.
- Navigate to the CloudWatch console and click Synthetics Canaries under Application monitoring. Click Create canary.
- Select the Use a blueprint radio button and select the Visual monitoring.
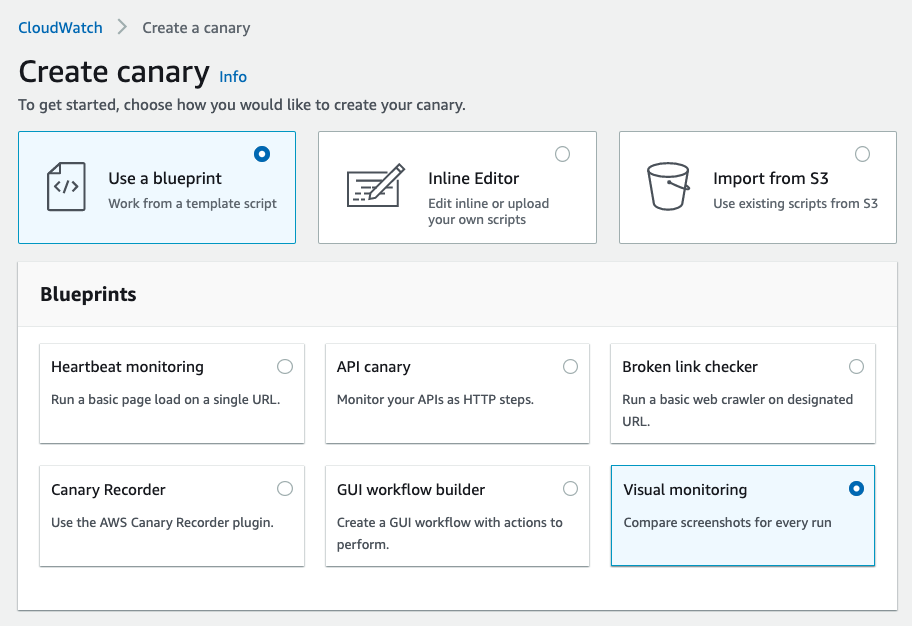
Figure 1: Create canary
- In the Canary builder section, provide a Name for the canary and specify the Application or endpoint URL of your application. Also specify the threshold for visual variance between screenshots of your application. I will leave it at 0 for now.
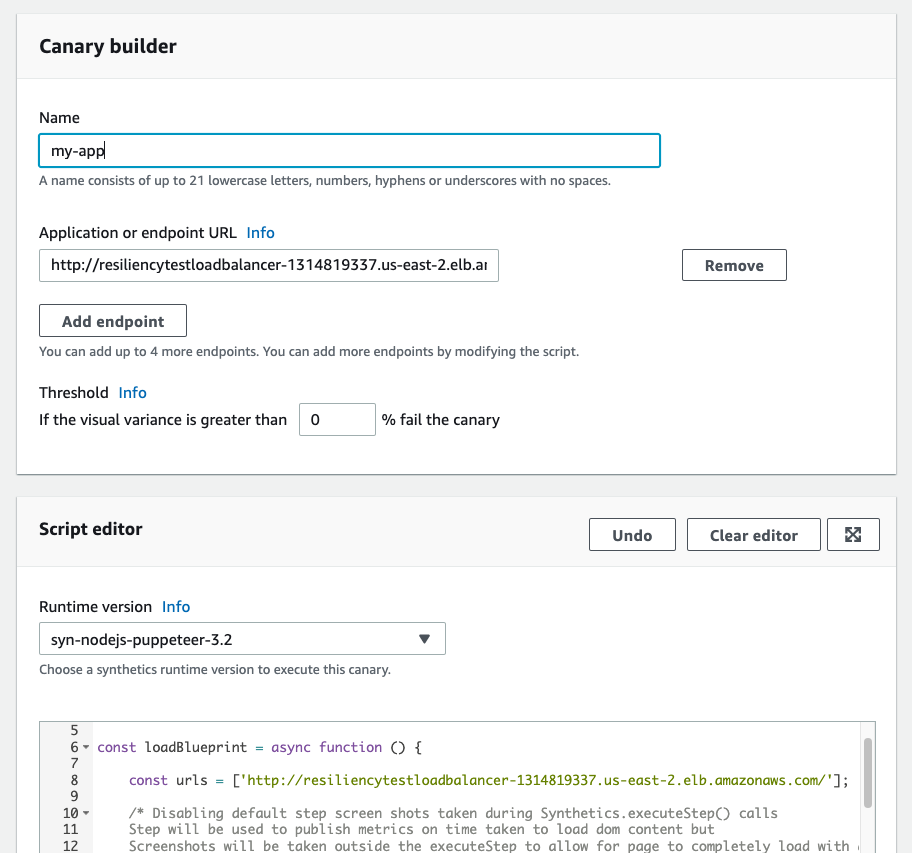
Figure 2: Configure canary
- Based on the blueprint selected and the configuration specified, CloudWatch Synthetics automatically generates the script that will be used for canary runs.
- Configure other options such as Schedule, Data Retention and Storage, Access permissions, and more. Refer to the CloudWatch Synthetics documentation on creating a canary to learn more about these options. I have used default values for all of these fields in this example.
- Click Create canary. CloudWatch Synthetics may take up to a minute to provision the resources needed for the canary runs. Once the canary has been created, you will automatically be returned to the canaries dashboard.

Figure 3: Canary create in progress
Viewing canary runs
After the canary has been created, it makes requests to the application or endpoint URL at the frequency that was specified and then captures responses received. The screenshot captured on the first run of the canary becomes the baseline and all subsequent screenshots are compared against this in order to detect variance.
- Click the canary you created from the list of canaries to view details of canary runs.
- You can see a summary of canary runs, such as the status of the latest run, issues detected in the last 24 hours, success % in the last 7 days, and the status of the canary.
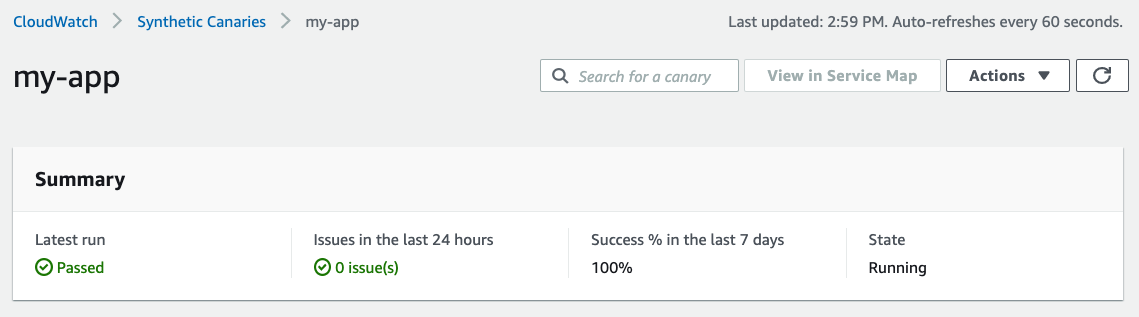
Figure 4: Canary summary
- The Availability tab provides details of issues in the last 24 hours, provides a graph of Passed and Failed canary runs, and other options such as Steps, Screenshots, Logs, and HAR files which allow you to drill down into specific canary runs.
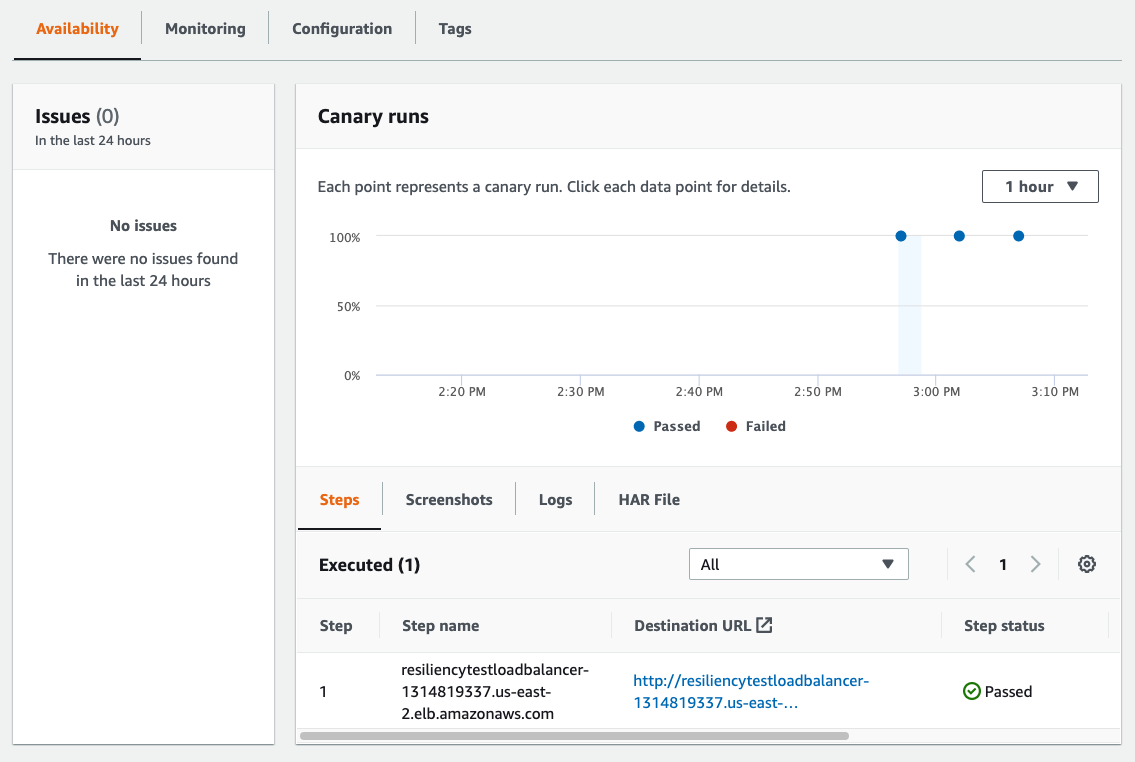
Figure 5: Availability tab
- Clicking the Screenshots tab and clicking the image there brings up the baseline screenshot, the screenshot from the latest run, and the visual variance percentage. No differences are identified here since I have not modified my application.

Figure 6: Baseline vs canary run
The application I am using is running on Amazon Elastic Compute Cloud (EC2) and returns the instance ID, Availability Zone, and other text, along with an image. The EC2 instance is part of an Amazon EC2 Auto Scaling group behind an Application Load Balancer. It is the only instance currently in the group. I will increase the group capacity to add 2 more instances and then observe the canary.

Figure 7: Sample application
I can see that some of the canary runs are failing and issues are being detected. Selecting one issue lets me drill down into the details. Under the issue description, I can see that the visual variance was 0.37%.
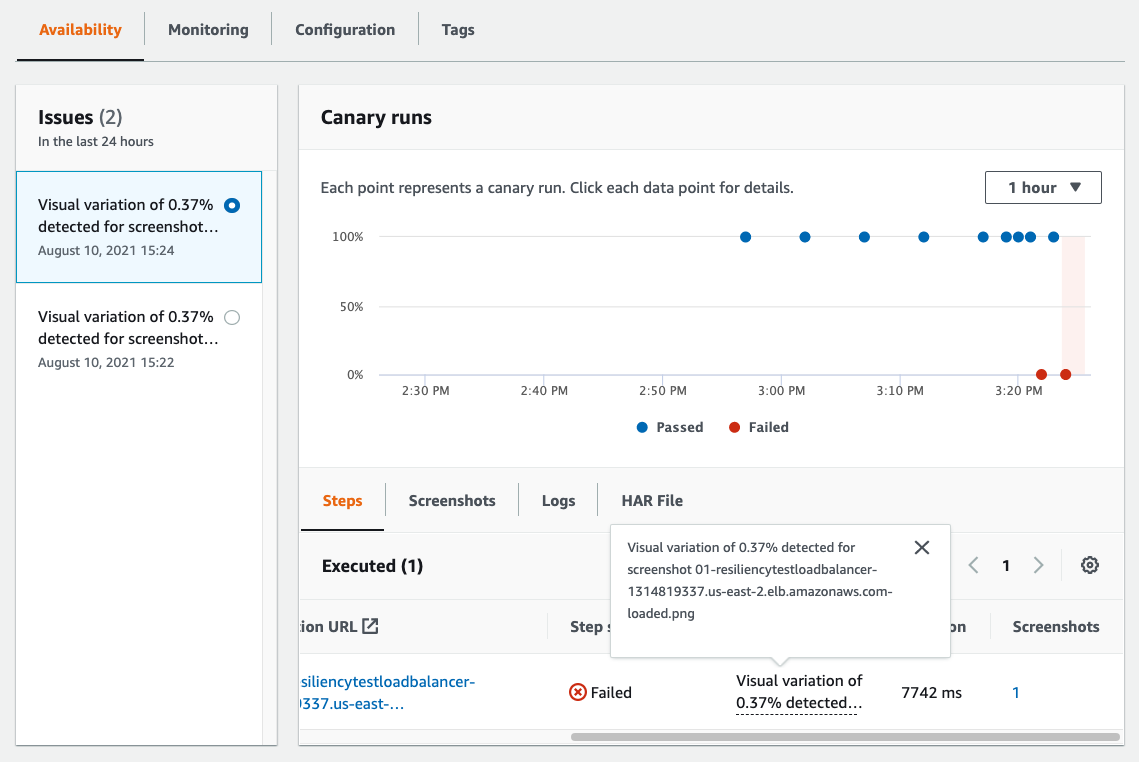
Figure 8: Issues detected
Clicking the Screenshots tab and then the image brings up the comparison between the baseline and the screenshot taken on that canary run.
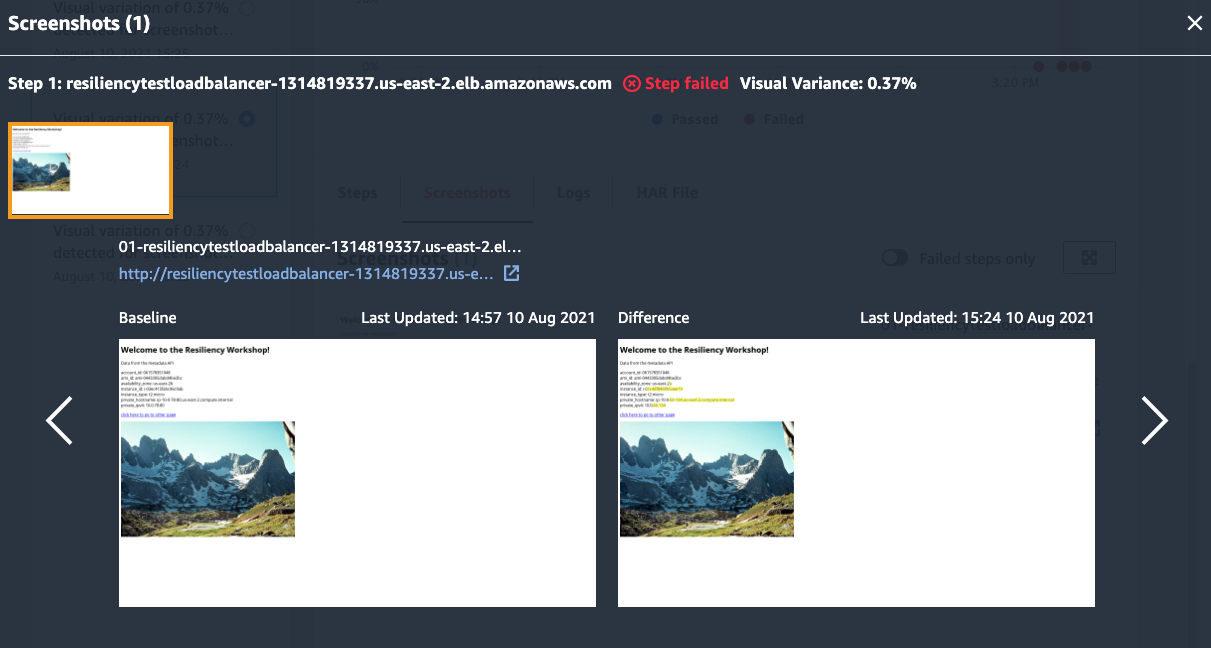
Figure 9: Baseline vs canary run with failure
Looking at the two images, I see differences which have been highlighted. I see that the instance_id, private_hostname, and private_ipv4 have changed. I can utilize this information to determine if this change is expected or not.
I have multiple instances in the Amazon EC2 Auto Scaling group for my application and each EC2 instance is returning information related to itself, resulting in changes to the data between runs. Requests from canary runs are being handled by a different EC2 instance each time. Therefore, the changes are expected.
Updating the canary
Now that we know the change is expected, the canary must be updated to prevent false positives. This can be achieved in multiple ways.
Update variance threshold
Based on the description for the issues detected, I see that the variance between the baseline and screenshots from the canary runs is 0.37%. Since this variance degree is expected, I can update the canary and increase the variance threshold (the default value is 0). I select my canary and, under Actions, choose to Edit the canary. On the edit page, I scroll down to the Script editor and locate the following line:
syntheticsConfiguration.withVisualVarianceThresholdPercentage(0)
This sets the canary variance threshold. Based on my data from previous canary runs, I can update the threshold to be 0.5%, and then save.
syntheticsConfiguration.withVisualVarianceThresholdPercentage(0.5)
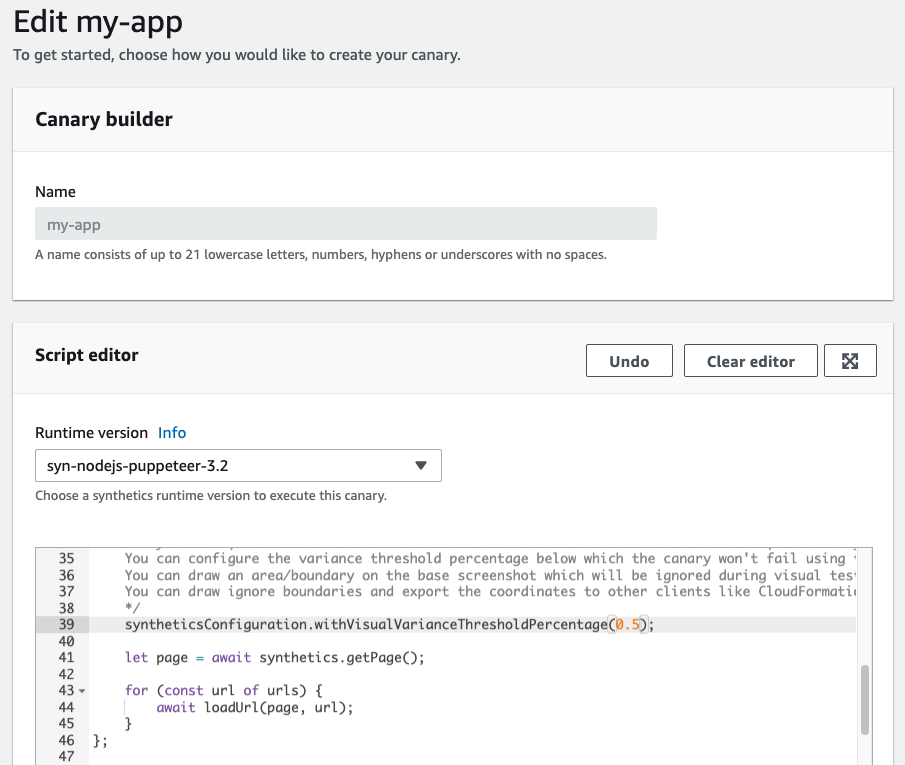
Figure 10: Edit canary
With the variance threshold increased to 0.5%, I can see that the subsequent canary runs are not failing and no issues are detected.

Figure 11: Canary summary and canary runs
Edit baseline screenshot
Alternatively, I can edit the baseline screenshot and have selected areas ignored during visual comparison. This is especially useful for applications containing dynamic content. To do this, I once again select my canary and, under Actions, choose Edit. I scroll down to Visual Monitoring and click Edit baseline.
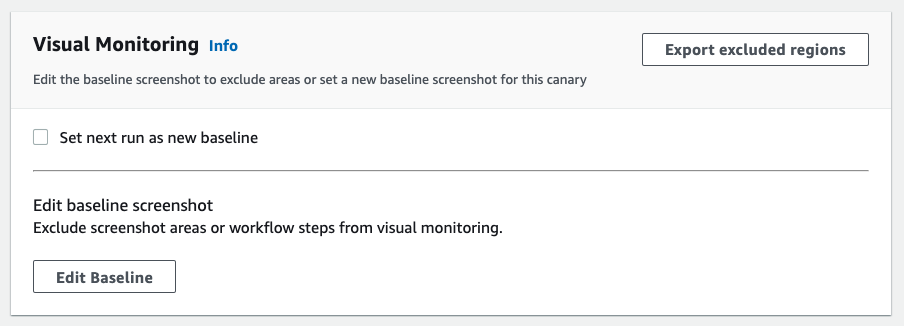
Figure 12: Edit baseline
This pulls up the current baseline screenshot. A simple click-drag lets me select an area of the screenshot to exclude from visual comparison for subsequent canary runs. In this case, I select the area where the text is located, since I know that this is the dynamic content in my application. I click Save to update the baseline, and then click Save again to update the canary. You can select more than one area to exclude from comparison if your applications have additional areas with dynamic content.
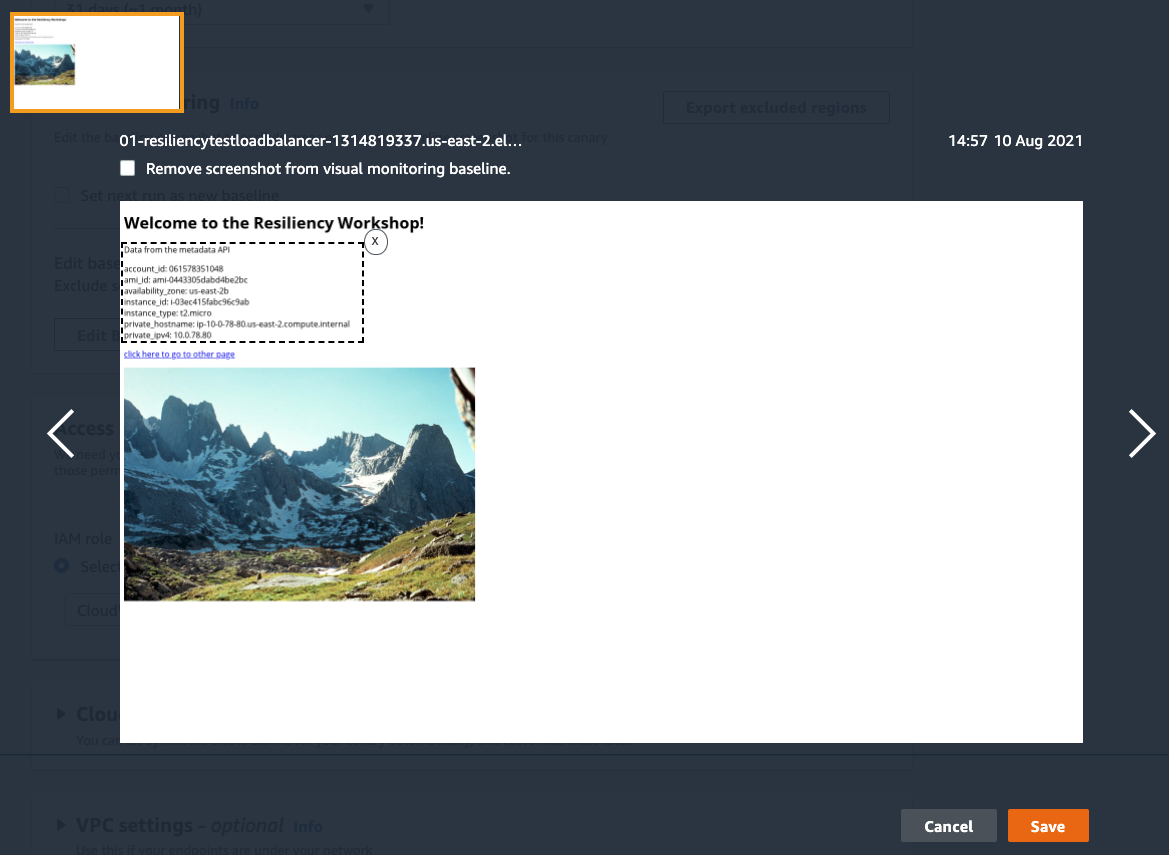
Figure 13: Update baseline
Application update
The image utilized as part of my application is stored in an Amazon Simple Storage Service (S3) bucket. Let’s assume that the image stored in the bucket was updated without me being aware of it, and my application now looks like this:

Figure 14: Sample application with new image
CloudWatch Synthetics quickly detects this change and the canary monitoring this application raises an issue. I can see from the issue description that there is a percentage of 25.53%, much higher than the threshold of 0.5% that I had set.
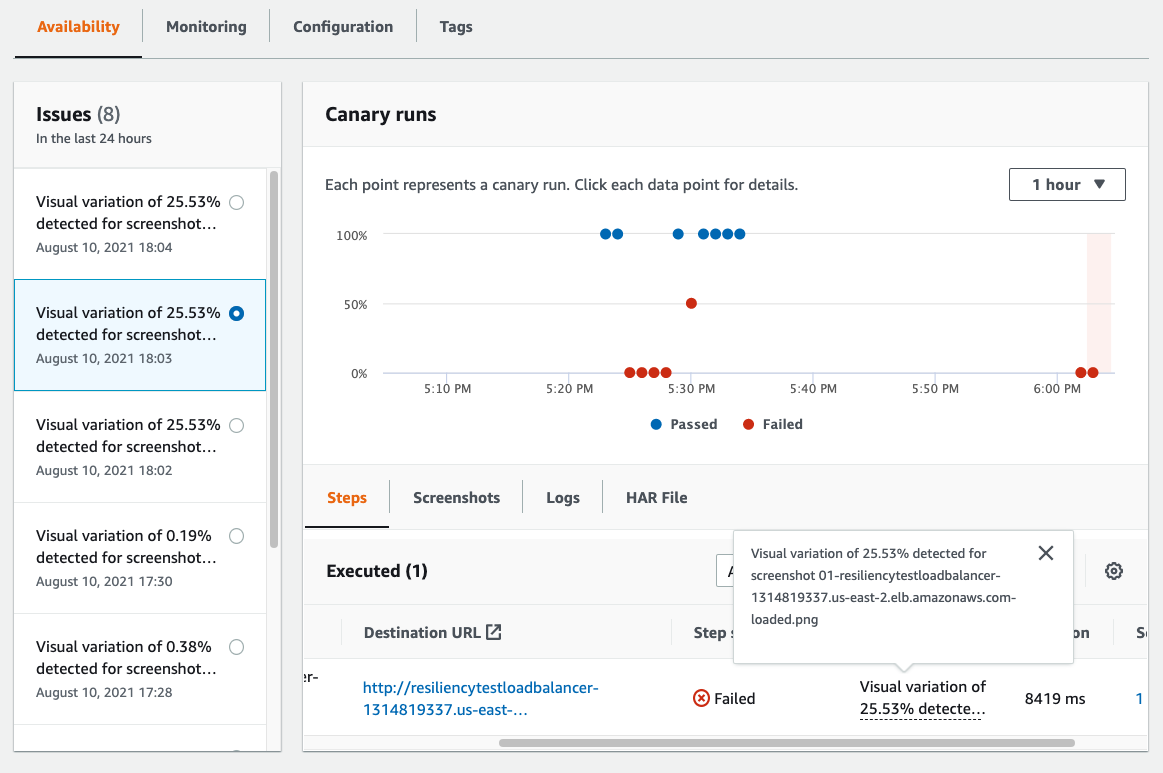
Figure 15: Canary run failures
Drilling down into the details of the failed canary run, the image being returned by my application is different from what is in the baseline. Using this information, I can determine if this change is desirable or not BEFORE it impacts end users.

Figure 16: Baseline vs canary run with failure
After determining that this change is intentional, I can update the canary so that subsequent canary runs do not detect this as an issue.
Set a new baseline
The baseline screenshot can be updated to reflect the application changes. To do this, click Actions and then choose to Edit the canary.
On the edit page, under Visual Monitoring, check the box next to Set next run as new baseline, and save changes. The screenshot taken during the next canary run will be used as the new baseline moving forward. Screenshots from all subsequent canary runs will be compared against this new baseline.

Figure 17: Set new baseline
As expected, subsequent canary runs are passing since the baseline has been updated.
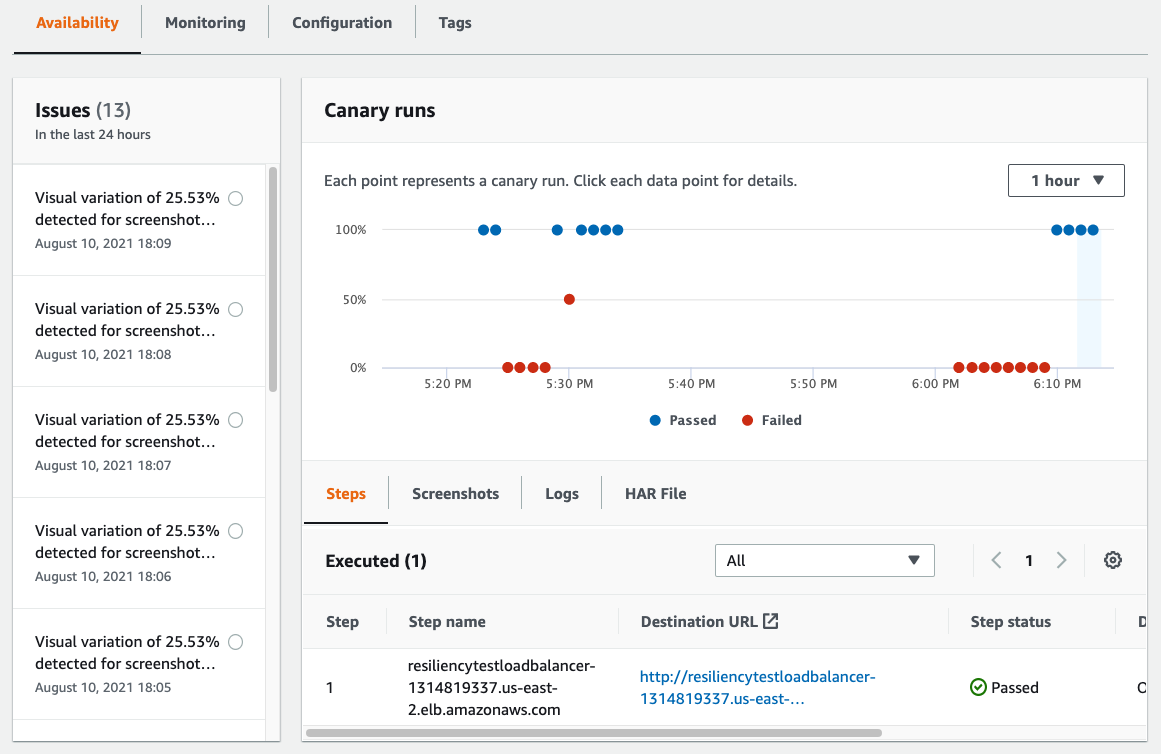
Figure 18: Successful canary runs
Clicking Screenshots and then clicking the screenshot lets me verify that the baseline has indeed been updated.
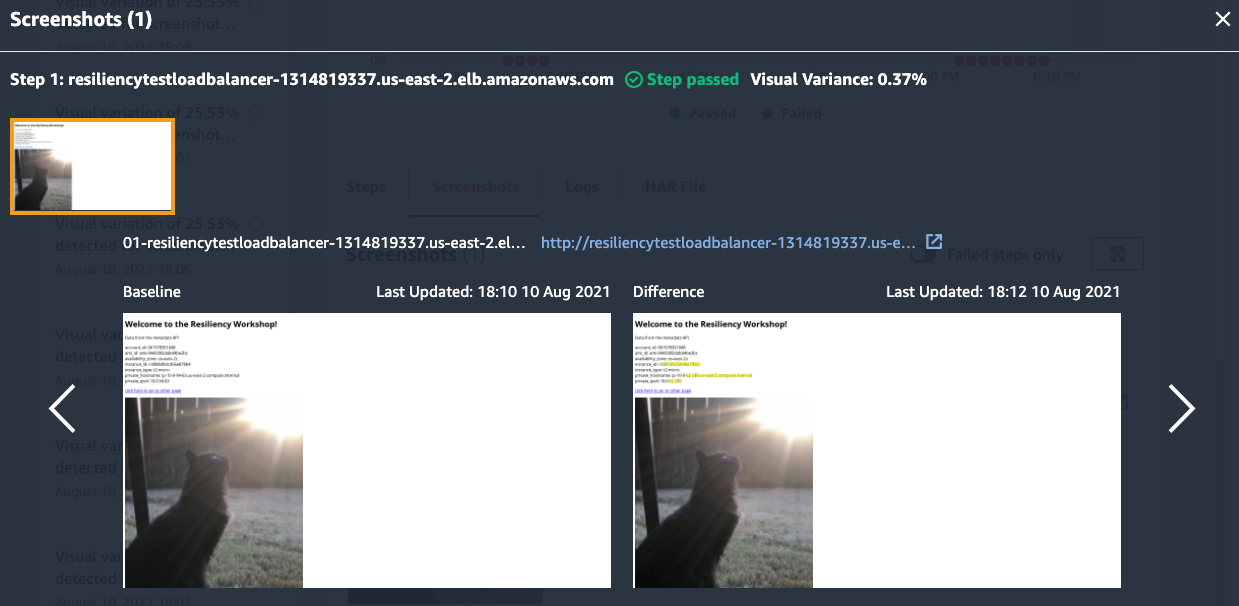
Figure 19: Updated baseline vs canary run
Other options
CloudWatch Synthetics offers various options and integrations that can be tailored for your use-case.
Enable/disable visual monitoring
If you already have CloudWatch Synthetics canaries monitoring your applications, you can update them to include visual monitoring. Select the canary into which you want to include visual monitoring, click Actions, and then Edit. Under Script editor, include the following line in the canary script in order to enable visual monitoring on that canary. Note that this is only supported for canaries running syn-puppeteer-node-3.2 and later.
syntheticsConfiguration.withVisualCompareWithBaseRun(true);
Customize canary response
When visual defects are detected, the default behavior of canaries conducting visual monitoring is to set the canary run status as Failed. Depending on your use-case, you may want to adjust this so that a canary does not fail when a visual variance is detected. This is particularly useful when you want to take different actions based on the failure type. For example, you might want to identify if a failure is due to a visual difference on the User Interface (UI) of an application, or if there was a page load failure due to an error with the backend system. In this case, you can utilize CloudWatch alarms to notify only the UI developer team instead of a generic maintenance team for the application. In order to do this, select the canary, click on Actions, and then Edit. Under Script editor, include the line:
syntheticsConfiguration.withFailCanaryRunOnVisualVariance(false)
This is what determines the canary behavior when visual differences are detected. In order to revert this change and have the canary fail when visual differences are detected, you can change this to:
syntheticsConfiguration.withFailCanaryRunOnVisualVariance(true)
Customize highlight color
CloudWatch Synthetics uses yellow (#fafa00) to highlight differences between canary run screenshots and the baseline. This setting can be customized by including the following line in the canary script and providing a hex value for the color of your choice.
syntheticsConfiguration.withVisualVarianceHighlightHexColor("<REPLACE WITH VALUE OF YOUR CHOICE>")
Monitoring and alerting
Canaries publish a variety of metrics to CloudWatch such as VisualMonitoringSuccessPercent, VisualMonitoringTotalComparisons, HTTP response codes, and more. Refer to the CloudWatch Synthetics documentation for a full list of metrics published by canaries. These metrics can be utilized to create CloudWatch alarms and receive alerts when visual differences are detected in your applications. Create alarms from the CloudWatch Synthetics console by editing your canary, or select from one of the available metrics under the CloudWatchSynthetics namespace from the CloudWatch Metrics console. Learn more about creating alarms in CloudWatch.
Cleanup
To avoid ongoing charges to your account, delete any canaries you may have created as part of reading through this blog post. For instructions, check editing or deleting a Canary in the Amazon CloudWatch User Guide.
Conclusion
This post showed how Amazon CloudWatch Synthetics canaries can now be utilized to conduct visual monitoring of your applications. By using the visual monitoring blueprint, you can quickly create canaries, or update existing canaries to include the visual monitoring of your applications. With the wide range of customizations supported by this new feature, you can tailor canaries specifically to your use-cases. This will enable you to identify visual defects with your application in a timely manner and thus take necessary action.
For more information, see Visual monitoring with CloudWatch Synthetics and Visual monitoring blueprint for CloudWatch Synthetics canaries in the Amazon CloudWatch User Guide.
Check out this video to learn how you can detect visual differences in your application using Amazon CloudWatch synthetics.