AWS Open Source Blog

Setting up Amazon Managed Grafana cross-account data source using customer managed IAM roles

Amazon Managed Grafana is a fully managed and secure data visualization service for open source Grafana that enables customers to instantly query, correlate, and visualize operational metrics, logs, and traces for their applications from multiple data sources. Amazon Managed Grafana integrates with multiple Amazon Web Services (AWS) security services, and supports AWS Single Sign-On (AWS SSO) and Security Assertion Markup Language (SAML) 2.0 to meet corporate security and compliance requirements. SAML authentication support lets you use an existing identity provider to offer single sign-on for accessing the Grafana console in your Amazon Managed Grafana workspace, manage access control, search data, and build visualizations. Read “Amazon Managed Grafana supports direct SAML integration with identity providers” to learn about Amazon Managed Grafana support for direct SAML integration.

As more AWS customers adopt a multi-account strategy, they’re using AWS Organizations and AWS Control Tower to build their landing zones. AWS Organizations helps you centrally provision, govern, and manage multi-account environments as you grow and scale AWS resources. AWS Control Tower uses the best practices and recommendations for setting up multi-account environments to secure, isolate, and manage your workloads.

Using long-term credentials as access keys is one approach to achieving cross-account access, but this approach poses security risk to comply with credentials rotation. As part of best practice, using an AWS Identity and Access Management (IAM) customer managed role to achieve cross-account access is a better approach to accessing data from AWS service sources in other AWS accounts. Using IAM customer managed roles creates temporary credentials using AWS Security Token Service (AWS STS).

In this blog post, we explain how to set up Amazon Managed Grafana to retrieve metrics from Amazon Managed Service for Prometheus and Amazon CloudWatch from different AWS accounts running container workloads using customer managed IAM roles.

Architecture

The following figure illustrates the architecture to set up and retrieve metrics from Amazon Managed Service for Prometheus and Amazon CloudWatch sources from different AWS accounts to Amazon Managed Grafana.

architecture diagram

Prerequisites

To deploy this solution, you must have the following prerequisites:

  • AWS Control Tower deployed in your AWS environment in the management account. If you have not already installed AWS Control Tower, follow the Getting Started with AWS Control Tower documentation, or you can enable AWS Organizations in the AWS Management Console account and enable AWS SSO.
  • An AWS account under AWS Control Tower called Workloads Account A provisioned using the AWS Service Catalog Account Factory product AWS Control Tower Account vending process.
  • An AWS account under AWS Control Tower called Workloads Account B provisioned using the AWS Service Catalog Account Factory product AWS Control Tower Account vending process.
  • An AWS account under AWS Control Tower called Grafana Account provisioned using the AWS Service Catalog Account Factory product AWS Control Tower Account vending process.
  • Install the following tools:

Set up AWS account profiles

Because we will be running this in three different accounts, you must make sure that you have profiles with credentials for both AWS accounts configured in ~/.aws/credentials and ~/.aws/config files. For example:

cat ~/.aws/credentials
[workload-a]
aws_access_key_id=...
aws_secret_access_key=...
[workload-b]
aws_access_key_id=...
aws_secret_access_key=...
[amg-account]
aws_access_key_id=...
aws_secret_access_key=...

cat ~/.aws/config
[profile workload-a]
region = us-west-2
[profile workload-b]
region = us-west-2
[profile amg-account]
region = us-west-2

Set up environment variables and create the Amazon EKS clusters

Use the following commands to set up required environment variables across all three AWS accounts:

## Env variables for Workload A account.
export AWS_PROFILE=workload-a
export AWS_REGION=us-west-2 ## <-- Change this to match your region
export AMP_WORKSPACE_NAME=AMG-cross-account-access
export WLDA_AWS_REGION=us-west-2 ## <-- Change this to match your region
export WLDA_USER=$(aws iam get-user --query 'User.[UserName]' --output text)
export WLDA_ACCOUNT_ID=$(aws sts get-caller-identity --query 'Account' --output text)
export WLDA_EKS_CLUSTER_NAME=eks-workloada-cluster

## Env variables for Workload B account.
export AWS_PROFILE=workload-b
export WLDB_AWS_REGION=us-west-2 ## <-- Change this to match your region
export WLDB_USER=$(aws iam get-user --query 'User.[UserName]' --output text)
export WLDB_ACCOUNT_ID=$(aws sts get-caller-identity --query 'Account' --output text)
export WLDB_EKS_CLUSTER_NAME=eks-workloadb-cluster

## Env variables for Grafana Account.
export AWS_PROFILE=amg-account
export AMG_AWS_REGION=us-west-2 ## <-- Change this to match your region
export AMG_ACCOUNT_ID=$(aws sts get-caller-identity --query 'Account' --output text)

Use the following commands to create an Amazon Elastic Kubernetes Service (Amazon EKS) clusters in workload accounts A and B:

## eksctl Cluster creation command for Workload A EKS cluster.
export AWS_PROFILE=workload-a
eksctl create cluster \
  --name $WLDA_EKS_CLUSTER_NAME \
  --region $WLDA_AWS_REGION \
  --managed

## eksctl Cluster creation command for workload B EKS cluster.
export AWS_PROFILE=workload-b
eksctl create cluster \
  --name $WLDB_EKS_CLUSTER_NAME \
  --region $WLDB_AWS_REGION \
  --managed

Use the following commands to switch contexts across the two Amazon EKS clusters as needed:

kubectl config use-context $WLDA_USER@$WLDA_EKS_CLUSTER_NAME.$WLDA_AWS_REGION.eksctl.io
kubectl config use-context $WLDB_USER@$WLDB_EKS_CLUSTER_NAME.$WLDB_AWS_REGION.eksctl.io

Note: As a best practice, create a VPCE endpoint for Amazon Managed Prometheus in VPCs for both of the workload accounts in which you will be deploying Amazon EKS clusters.

Setting up an IAM role and an Amazon Managed Prometheus workspace in the Workload A account

An Amazon Managed Prometheus workspace is the conceptual location where you ingest, store, and query Prometheus metrics that were collected from application workloads, isolated from other Amazon Managed Prometheus workspaces. One or more workspaces may be created in each Region within the same AWS account, and each workspace can be used to ingest metrics from multiple workloads that export metrics in a Prometheus-compatible format.

To create an Amazon Managed Prometheus workspace, use the following AWS CLI command:

export AWS_PROFILE=workload-a
kubectl config use-context $WLDA_USER@$WLDA_EKS_CLUSTER_NAME.$WLDA_AWS_REGION.eksctl.io
aws amp create-workspace --alias $AMP_WORKSPACE_NAME --region $WLDA_AWS_REGION

Now, let’s create an IAM role AMGPrometheusDataSourceRole with permissions to access Amazon Managed Prometheus workspace in the Workload A account. This IAM role will be used by Amazon Managed Grafana to query metrics from Amazon Managed Prometheus workspace.

First, we will create the IAM trust policy. Add the following content in a file called amp_trust_policy.json. This IAM trust policy will ensure that we have permissions to assume AMGPrometheusDataSourceRole from the Amazon Managed Grafana account.

cat > amp_trust_policy.json << EOF
{
    "Version": "2012-10-17",
    "Statement": [
        {
            "Effect": "Allow",
            "Principal": {
                "AWS": "arn:aws:iam::${AMG_ACCOUNT_ID}:root"
            },
            "Action": "sts:AssumeRole",
            "Condition": {}
        }
    ]
}
EOF

To create the IAM role, run the following command:

aws iam create-role --role-name AMGPrometheusDataSourceRole --assume-role-policy-document file://amp_trust_policy.json

To create the IAM permissions policy, add the following content in a file called amp_permission_policy.json:

cat > amp_permission_policy.json << EOF
{
    "Version": "2012-10-17",
    "Statement": [
        {
            "Effect": "Allow",
            "Action": [
                "aps:ListWorkspaces",
                "aps:DescribeWorkspace",
                "aps:QueryMetrics",
                "aps:GetLabels",
                "aps:GetSeries",
                "aps:GetMetricMetadata"
            ],
            "Resource": "*"
        }
    ]
}
EOF

Now we can attach the preceding Amazon Managed Prometheus workspace permissions policy to IAM role AMGPrometheusDataSourceRole:

aws iam put-role-policy --role-name AMGPrometheusDataSourceRole --policy-name AMGPrometheusPermissionPolicy --policy-document file://amp_permission_policy.json                           

Test the policy attached to the IAM role AMGPrometheusDataSourceRole:

aws iam get-role-policy --role-name AMGPrometheusDataSourceRole --policy-name AMGPrometheusPermissionPolicy

To get the AMGPrometheusDataSourceRole IAM role ARN:

AMGPrometheusDataSourceRoleARN=$(aws iam get-role --role-name AMGPrometheusDataSourceRole --query 'Role.[Arn]' --output text)

This will be used later in the article.

Running a container workload to push metrics to Amazon Managed Prometheus workspace in Workload A account

AWS Load Balancer Controller setup

Switch the Kubernetes context to the Workload A Amazon EKS cluster. Run the following commands to deploy the AWS Load Balancer Controller into your cluster:

## Download the IAM policy document
curl -S https://raw.githubusercontent.com/kubernetes-sigs/aws-load-balancer-controller/v2.2.0/docs/install/iam_policy.json -o iam-policy.json

## Create an IAM policy 
aws iam create-policy \
  --policy-name AWSLoadBalancerControllerIAMPolicy-AMGDEMO \
  --policy-document file://iam-policy.json 2> /dev/null

## Create OIDC Provider
eksctl utils associate-iam-oidc-provider \
--region=$WLDA_AWS_REGION \
--cluster=$WLDA_EKS_CLUSTER_NAME \
--approve

## Create a service account 
eksctl create iamserviceaccount \
  --cluster=$WLDA_EKS_CLUSTER_NAME \
  --region $WLDA_AWS_REGION \
  --namespace=kube-system \
  --name=aws-load-balancer-controller \
  --override-existing-serviceaccounts \
  --attach-policy-arn=arn:aws:iam::${WLDA_ACCOUNT_ID}:policy/AWSLoadBalancerControllerIAMPolicy-AMGDEMO \
  --approve

## Get EKS cluster VPC ID
export WLDA_VPC_ID=$(aws eks describe-cluster \
  --name $WLDA_EKS_CLUSTER_NAME \
  --region $WLDA_AWS_REGION  \
  --query "cluster.resourcesVpcConfig.vpcId" \
  --output text)

helm repo add eks https://aws.github.io/eks-charts && helm repo update

kubectl apply -k "github.com/aws/eks-charts/stable/aws-load-balancer-controller//crds?ref=master"

helm install aws-load-balancer-controller \
  eks/aws-load-balancer-controller \
  --namespace kube-system \
  --set clusterName=$WLDA_EKS_CLUSTER_NAME \
  --set serviceAccount.create=false \
  --set serviceAccount.name=aws-load-balancer-controller \
  --set vpcId=$WLDA_VPC_ID \
  --set region=$WLDA_AWS_REGION

Deploy a demo (Yelb) app

Read “Service connectivity inside and outside the mesh using AWS App Mesh (ECS/Fargate)” to learn about the Yelb demo app. In order to deploy our demo app called Yelb, run the following:

git clone https://github.com/aws/aws-app-mesh-examples.git 
cd aws-app-mesh-examples/walkthroughs/eks-getting-started/
kubectl apply -f infrastructure/yelb_initial_deployment.yaml

To get the URL of the load balancer for carrying out testing in your browser, use the following command:

$ kubectl get service yelb-ui -n yelb
NAME      TYPE           CLUSTER-IP      EXTERNAL-IP                                                               PORT(S)        AGE
yelb-ui   LoadBalancer   172.20.19.116   a96f5309de3csdc19847045bfbd34bd4-XXXXXXXXXX.us-west-2

Send metrics to Amazon Managed Prometheus in the Workload A account

The following shell script can be used to perform the following actions:

  • Creates an IAM role with an IAM policy that has permissions to remote-write into an Amazon Managed Prometheus workspace
  • Creates a Kubernetes service account that is annotated with the IAM role
  • Creates a trust relationship between the IAM role and the OIDC provider hosted in your Amazon EKS cluster
CLUSTER_NAME=$WLDA_EKS_CLUSTER_NAME
SERVICE_ACCOUNT_NAMESPACE=prometheus
AWS_ACCOUNT_ID=$WLDA_ACCOUNT_ID
OIDC_PROVIDER=$(aws eks describe-cluster --name $CLUSTER_NAME --query "cluster.identity.oidc.issuer" --output text | sed -e "s/^https:\/\///")
SERVICE_ACCOUNT_AMP_INGEST_NAME=amp-iamproxy-ingest-service-account
SERVICE_ACCOUNT_IAM_AMP_INGEST_ROLE=amp-iamproxy-ingest-role
SERVICE_ACCOUNT_IAM_AMP_INGEST_POLICY=AMPIngestPolicy
#
# Set up a trust policy designed for a specific combination of K8s service account and namespace to sign in from a Kubernetes cluster which hosts the OIDC Idp.
#
cat < TrustPolicy.json
{
  "Version": "2012-10-17",
  "Statement": [
    {
      "Effect": "Allow",
      "Principal": {
        "Federated": "arn:aws:iam::${AWS_ACCOUNT_ID}:oidc-provider/${OIDC_PROVIDER}"
      },
      "Action": "sts:AssumeRoleWithWebIdentity",
      "Condition": {
        "StringEquals": {
          "${OIDC_PROVIDER}:sub": "system:serviceaccount:${SERVICE_ACCOUNT_NAMESPACE}:${SERVICE_ACCOUNT_AMP_INGEST_NAME}"
        }
      }
    }
  ]
}
EOF
#
# Set up the permission policy that grants ingest (remote write) permissions for all AMP workspaces
#
cat < PermissionPolicyIngest.json
{
  "Version": "2012-10-17",
   "Statement": [
       {"Effect": "Allow",
        "Action": [
           "aps:RemoteWrite", 
           "aps:GetSeries", 
           "aps:GetLabels",
           "aps:GetMetricMetadata"
        ], 
        "Resource": "*"
      }
   ]
}
EOF

function getRoleArn() {
  OUTPUT=$(aws iam get-role --role-name $1 --query 'Role.Arn' --output text 2>&1)

  # Check for an expected exception
  if [[ $? -eq 0 ]]; then
    echo $OUTPUT
  elif [[ -n $(grep "NoSuchEntity" <<< $OUTPUT) ]]; then echo "" else >&2 echo $OUTPUT
    return 1
  fi
}

#
# Create the IAM Role for ingest with the above trust policy
#
SERVICE_ACCOUNT_IAM_AMP_INGEST_ROLE_ARN=$(getRoleArn $SERVICE_ACCOUNT_IAM_AMP_INGEST_ROLE)
if [ "$SERVICE_ACCOUNT_IAM_AMP_INGEST_ROLE_ARN" = "" ]; 
then
  #
  # Create the IAM role for service account
  #
  SERVICE_ACCOUNT_IAM_AMP_INGEST_ROLE_ARN=$(aws iam create-role \
  --role-name $SERVICE_ACCOUNT_IAM_AMP_INGEST_ROLE \
  --assume-role-policy-document file://TrustPolicy.json \
  --query "Role.Arn" --output text)
  #
  # Create an IAM permission policy
  #
  SERVICE_ACCOUNT_IAM_AMP_INGEST_ARN=$(aws iam create-policy --policy-name $SERVICE_ACCOUNT_IAM_AMP_INGEST_POLICY \
  --policy-document file://PermissionPolicyIngest.json \
  --query 'Policy.Arn' --output text)
  #
  # Attach the required IAM policies to the IAM role created above
  #
  aws iam attach-role-policy \
  --role-name $SERVICE_ACCOUNT_IAM_AMP_INGEST_ROLE \
  --policy-arn $SERVICE_ACCOUNT_IAM_AMP_INGEST_ARN  
else
    echo "$SERVICE_ACCOUNT_IAM_AMP_INGEST_ROLE_ARN IAM role for ingest already exists"
fi
echo $SERVICE_ACCOUNT_IAM_AMP_INGEST_ROLE_ARN
#
# EKS cluster hosts an OIDC provider with a public discovery endpoint.
# Associate this IdP with AWS IAM so that the latter can validate and accept the OIDC tokens issued by Kubernetes to service accounts.
# Doing this with eksctl is the easier and best approach.
#
eksctl utils associate-iam-oidc-provider --cluster $CLUSTER_NAME --approve

Amazon Managed Service for Prometheus does not directly scrape operational metrics from containerized workloads in a Kubernetes cluster. It requires users to deploy and manage a standard Prometheus server, or an OpenTelemetry agent—such as the AWS Distro for OpenTelemetry Collector—in their cluster to perform this task.

Run the following commands to deploy the Prometheus server on the Amazon EKS cluster:

helm repo add prometheus-community https://prometheus-community.github.io/helm-charts
kubectl create ns prometheus
WORKSPACE_ID=$(aws amp list-workspaces --alias $AMP_WORKSPACE_NAME --region=${AWS_REGION} --query 'workspaces[0].[workspaceId]' --output text)

Create a file called amp_ingest_override_values.yaml as show in the following:

cat > amp_ingest_override_values.yaml << EOF
serviceAccounts:
        server:
            name: "amp-iamproxy-ingest-service-account"
            annotations:
                eks.amazonaws.com/role-arn: "${SERVICE_ACCOUNT_IAM_AMP_INGEST_ROLE_ARN}"
server:
    sidecarContainers:
        aws-sigv4-proxy-sidecar:
           image: public.ecr.aws/aws-observability/aws-sigv4-proxy:1.0
           args:
           - --name
           - aps
           - --region
           - ${AWS_REGION}
           - --host
           - aps-workspaces.${AWS_REGION}.amazonaws.com
           - --port
           - :8005
           ports:
           - name: aws-sigv4-proxy
             containerPort: 8005
    statefulSet:
        enabled: "true"
    remoteWrite:
        - url: http://localhost:8005/workspaces/${WORKSPACE_ID}/api/v1/remote_write

EOF

Run the following command to install the Prometheus server configuration and configure the remoteWrite endpoint:

helm install prometheus-for-amp prometheus-community/prometheus -n prometheus -f ./amp_ingest_override_values.yaml

Running a container workload and setting up CloudWatch Container Insights in the Workload B account

Use the following command to switch the profile to a Kubernetes cluster in the Workload B account:

export AWS_PROFILE=workload-b
kubectl config use-context $WLDB_USER@$WLDB_EKS_CLUSTER_NAME.$WLDB_AWS_REGION.eksctl.io

Repeat the following steps from the previous section in Workload A account to run the Yelb app in the Workload B account:

  • AWS Load Balancer Controller setup (replace WLDA variables with WLDB while following the steps for Workload B).
  • Deploy a demo app

Setting up an IAM role in a Workload B account

Next, let’s create an IAM role with permissions to access CloudWatch in the Workload B account.

First, we must create the IAM trust policy. Add the following content in a file called cw_trust_policy.json. This IAM trust policy will ensure we have permissions to assume AMGCloudWatchDataSourceRole from the Amazon Managed Grafana account.

cat > cw_trust_policy.json << EOF
{
    "Version": "2012-10-17",
    "Statement": [
        {
            "Effect": "Allow",
            "Principal": {
                "AWS": "arn:aws:iam::${AMG_ACCOUNT_ID}:root"
            },
            "Action": "sts:AssumeRole",
            "Condition": {}
        }
    ]
}
EOF

To create the IAM role, run:

aws iam create-role --role-name AMGCloudWatchDataSourceRole --assume-role-policy-document file://cw_trust_policy.json

To create the permissions policy, add the following content in a file called cw_permission_policy.json:

cat > cw_permission_policy.json << EOF
{
  "Version": "2012-10-17",
  "Statement": [
    {
      "Sid": "AllowReadingMetricsFromCloudWatch",
      "Effect": "Allow",
      "Action": [
        "cloudwatch:DescribeAlarmsForMetric",
        "cloudwatch:DescribeAlarmHistory",
        "cloudwatch:DescribeAlarms",
        "cloudwatch:ListMetrics",
        "cloudwatch:GetMetricStatistics",
        "cloudwatch:GetMetricData"
      ],
      "Resource": "*"
    },
    {
      "Sid": "AllowReadingLogsFromCloudWatch",
      "Effect": "Allow",
      "Action": [
        "logs:DescribeLogGroups",
        "logs:GetLogGroupFields",
        "logs:StartQuery",
        "logs:StopQuery",
        "logs:GetQueryResults",
        "logs:GetLogEvents"
      ],
      "Resource": "*"
    },
    {
      "Sid": "AllowReadingTagsInstancesRegionsFromEC2",
      "Effect": "Allow",
      "Action": ["ec2:DescribeTags", "ec2:DescribeInstances", "ec2:DescribeRegions"],
      "Resource": "*"
    },
    {
      "Sid": "AllowReadingResourcesForTags",
      "Effect": "Allow",
      "Action": "tag:GetResources",
      "Resource": "*"
    }
  ]
}
EOF

Now attach the preceding permissions policy to the IAM role AMGCloudWatchDataSourceRole:

aws iam put-role-policy --role-name AMGCloudWatchDataSourceRole --policy-name AMGCloudWatchPermissionPolicy --policy-document file://cw_permission_policy.json

Test the policy attached to the IAM role AMGCloudWatchDataSourceRole:

aws iam get-role-policy --role-name AMGCloudWatchDataSourceRole --policy-name AMGCloudWatchPermissionPolicy  

To get the AMGCloudWatchDataSourceRole IAM role ARN, which will be used later in this article:

AMGCloudWatchDataSourceRoleARN=$(aws iam get-role --role-name AMGCloudWatchDataSourceRole --query 'Role.[Arn]' --output text)

Send metrics via CloudWatch Container Insights to Amazon CloudWatch in Workload B account

Add the necessary policy to the IAM role for your worker nodes

In order for CloudWatch to get the necessary monitoring info, we must install the CloudWatch Agent to our Amazon EKS cluster.

First, we must ensure that the role name our workers use is set in our environment:

STACK_NAME=$(aws cloudformation list-stacks  | jq -r '.StackSummaries[].StackName' | grep 'nodegroup')
ROLE_NAME=$(aws cloudformation describe-stack-resources --stack-name $STACK_NAME --region $WLDB_AWS_REGION | jq -r '.StackResources[] | select(.ResourceType=="AWS::IAM::Role") | .PhysicalResourceId')
echo "ROLE_NAME=${ROLE_NAME}"

We will attach the policy to the nodes IAM role:

aws iam attach-role-policy \
    --role-name $ROLE_NAME \
    --policy-arn arn:aws:iam::aws:policy/CloudWatchAgentServerPolicy

Finally, let’s verify that the policy has been attached to the IAM role:

aws iam list-attached-role-policies --role-name $ROLE_NAME | grep CloudWatchAgentServerPolicy || echo 'Policy not found'

Now we can proceed to the actual install of the CloudWatch Container Insights.

Installing CloudWatch Container Insights

To complete CloudWatch Container Insights set install, you can follow the quickstart instructions in this section. Run the following command:

curl -s https://raw.githubusercontent.com/aws-samples/amazon-cloudwatch-container-insights/latest/k8s-deployment-manifest-templates/deployment-mode/daemonset/container-insights-monitoring/quickstart/cwagent-fluentd-quickstart.yaml | sed "s/{{cluster_name}}/$WLDB_EKS_CLUSTER_NAME/;s/{{region_name}}/${AWS_REGION}/" | kubectl apply -f -

The command will:

  • Create the namespace amazon-cloudwatch.
  • Create the necessary security objects for both DaemonSet:
    • SecurityAccount
    • ClusterRole
    • ClusterRoleBinding
  • Deploy CloudWatch agent, which is responsible for sending the metrics to CloudWatch, as a DaemonSet.
  • Deploy fluentd (responsible for sending the logs to CloudWatch) as a DaemonSet.
  • Deploy ConfigMap configurations for both DaemonSets.

Find additional information and manual install steps in the documentation.

Verify that the DaemonSets have been deployed by running the following command:

kubectl -n amazon-cloudwatch get daemonsets

The output looks like the following:

NAME                 DESIRED   CURRENT   READY   UP-TO-DATE   AVAILABLE   NODE SELECTOR   AGE
cloudwatch-agent     2         2         2       2            2                     2m43s
fluentd-cloudwatch   2         2         2       2            2                     2m43s

That’s it. It’s that simple to install the agent and get it up and running. You can follow the manual steps in the full documentation, but with the quickstart the daemon deployment is simplified.

Verifying CloudWatch Container Insights in the console

To verify that data is being collected in CloudWatch, launch the CloudWatch Containers UI in a browser using the link generated by the following command:

echo "
Use the URL below to access Cloudwatch Container Insights in $AWS_REGION:
https://${AWS_REGION}.console.aws.amazon.com/cloudwatch/home?region=${AWS_REGION}#container-insights:performance/EKS:Service?~(query~(controls~(CW*3a*3aEKS.cluster~(~'${WLDB_EKS_CLUSTER_NAME}')))~context~())"

Grafana account setup

Setting up a cross account role for Amazon Managed Grafana in a Grafana account

To query metrics from Amazon Managed Prometheus workspace in Workload A account and access CloudWatch Logs from Workload B and to display in a Grafana dashboard in a Grafana account, we will create a new IAM role in a Grafana account that can assume the existing IAM roles AMGPrometheusDataSourceRole and AMGCloudWatchDataSourceRole.

First, we must create the IAM trust policy in a Grafana account, and add the following content in a file called amg_role_trust_policy.json:

export AWS_PROFILE=amg-account
cat > amg_role_trust_policy.json << EOF
{
  "Version": "2012-10-17",
  "Statement": [
  {
      "Effect": "Allow",
      "Principal": {
        "Service": "grafana.amazonaws.com"
      },
      "Action": "sts:AssumeRole"
    }
 ]
}
EOF

We can now proceed to create IAM role AMGWorkspaceRole:

aws iam create-role --role-name AMGWorkspaceRole --assume-role-policy-document file://amg_role_trust_policy.json

Now, let’s add permissions to this new role to assume IAM roles AMGPrometheusDataSourceRole and AMGCloudWatchDataSourceRole in Workload A and Workload B accounts:

cat > amg_workspace_permission_policy.json << EOF
{
    "Version": "2012-10-17",
    "Statement": [
    {
        "Effect": "Allow",
        "Action": "sts:AssumeRole",
        "Resource": "arn:aws:iam::${WLDB_ACCOUNT_ID}:role/AMGCloudWatchDataSourceRole"
    },
    {
        "Effect": "Allow",
        "Action": "sts:AssumeRole",
        "Resource": "arn:aws:iam::${WLDA_ACCOUNT_ID}:role/AMGPrometheusDataSourceRole"
    }
   ]
}
EOF
aws iam put-role-policy --role-name AMGWorkspaceRole  --policy-name AMGWorkspacePermissionPolicy --policy-document file://amg_workspace_permission_policy.json

To validate if policy has been attached to the AMGWorkspaceRole:

aws iam get-role-policy --role-name AMGWorkspaceRole  --policy-name AMGWorkspacePermissionPolicy

AWS SSO in the management account

To use Amazon Managed Grafana in a flexible and convenient manner, we chose to leverage AWS SSO for user management. AWS SSO is available once you’ve enabled AWS Organizations manually, or it’s auto-enabled while setting up AWS Control Tower.

Amazon Managed Grafana integrates with AWS SSO to provide identity federation for your workforce. With Amazon Managed Grafana and AWS SSO, you are redirected to an existing company directory to sign in with existing credentials. Then, you are seamlessly signed in to the Amazon Managed Grafana workspace. This ensures that security settings, such as password policies and two-factor authentication, are enforced. Using AWS SSO does not impact your existing IAM configuration.

Create Amazon Managed Grafana workspace in a Grafana account and query metrics from Amazon Managed Prometheus workspace in Workload A, and CloudWatch in Workload B

You can spin up on-demand, autoscaled Grafana workspaces (virtual Grafana servers) that let you create unified dashboards across multiple data sources. Before we can use Amazon Managed Grafana for the following example, we must set it up. In the following, we’re using the AWS Management Console to walk through the required steps and comment on considerations when performing each step.

After selecting Create new workspace in the Amazon Managed Grafana console landing page, name the new workspace and optionally add a description:

In this step, you also must enable AWS SSO for Amazon Managed Grafana, because this is how we manage user authentication to Grafana workspaces. Select Customer managed as the permission type and choose the Amazon Managed Grafana-cust-managed-role created in the previous step:

Select Customer Managed as the permission type and choose the Amazon Managed Grafana-cust-managed-role created in the previous step

Select Next in the Service managed permission settings screen without any selection. To create the Amazon Managed Grafana workspace in the next screen, choose Create workspace without any selections.

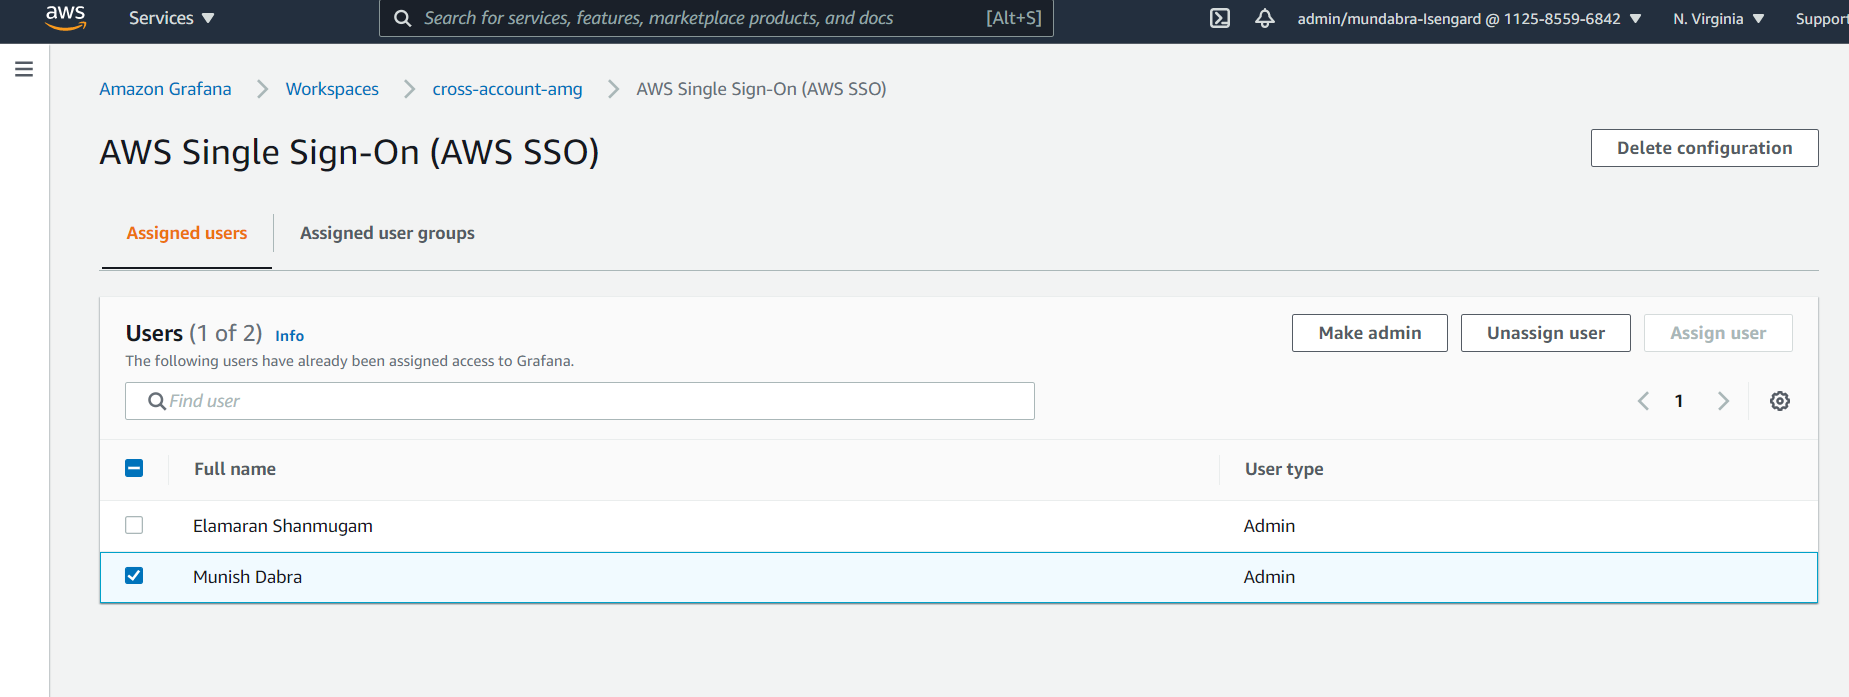
By default, the SSO user has Viewer permissions. Because we will be adding new data sources and creating a dashboard in Amazon Managed Grafana, you would want to update the user type as Admin.

Under Authentication, select Configure users and user groups, select the SSO user you want to use to log in to Grafana, and choose Make admin button:

Under Authentication, select Configure users and user groups, select the SSO user you want to use to log in to Grafana, and choose Make admin button

Query metrics in Grafana account from Amazon Managed Prometheus workspace in Workload A account

Once you’re logged into the Amazon Managed Grafana console, add the Amazon Managed Prometheus datasource by selecting Configuration, Data sources.

Choose Add data source, Prometheus:

Choose Add data source, Prometheus:

Configure Prometheus data source

For Name, let’s add AMPDataSource (or a name you choose).

For URL, add the Amazon Managed Prometheus workspace remote_write URL from Workload A without the api/v1/remote_write on the end.

Enable SigV4 auth.

For SigV4Auth Auth Details:

  • For Authentication Provider, choose Workspace IAM Role from the dropdown.
  • For Assume Role ARN, use ARN of AMGPrometheusDataSourceRole from environment variable AMGPrometheusDataSourceRoleARN.
  • For Default Region, choose the region where you created the Amazon Managed Prometheus workspace.

screenshot of options for SigV4Auth Auth Details

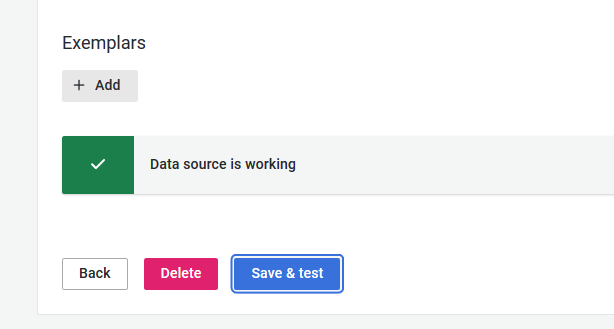
Select Save & test. You should be shown that the data source is working.

The Amazon Managed Prometheus data source is authenticated through a SigV4 protocol. Grafana (7.3.5 and higher) has the AWS SigV4 proxy built-in as a plugin, which makes this possible.

To query metrics, choose Explore and enter the query apiserver_current_inflight_requests. You will get a screen similar to the following, which shows that we are able to query metrics successfully from the Amazon EKS cluster through the Amazon Managed Prometheus workspace:

You can also import existing dashboard by selecting the plus sign (+) and selecting Import.

In the Import screen, type 3119 in Import via grafana.com and choose Import.

Select the AMPDataSource from the dropdown at the bottom and select Import.

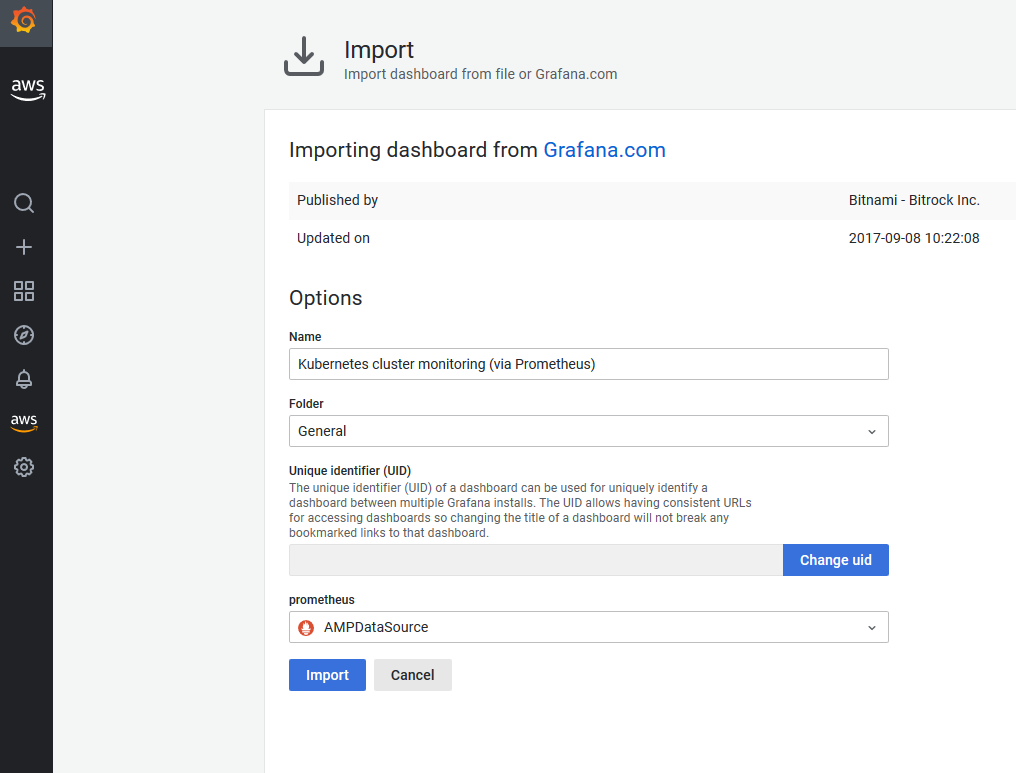
Once the import completes, the Grafana dashboard with show metrics from the Amazon EKS cluster through Amazon Managed Prometheus data source:

Query metrics in the Grafana account from Amazon CloudWatch in Workload B account

Configure CloudWatch data source

Select AWS services, which will present a screen showing the available AWS data sources:

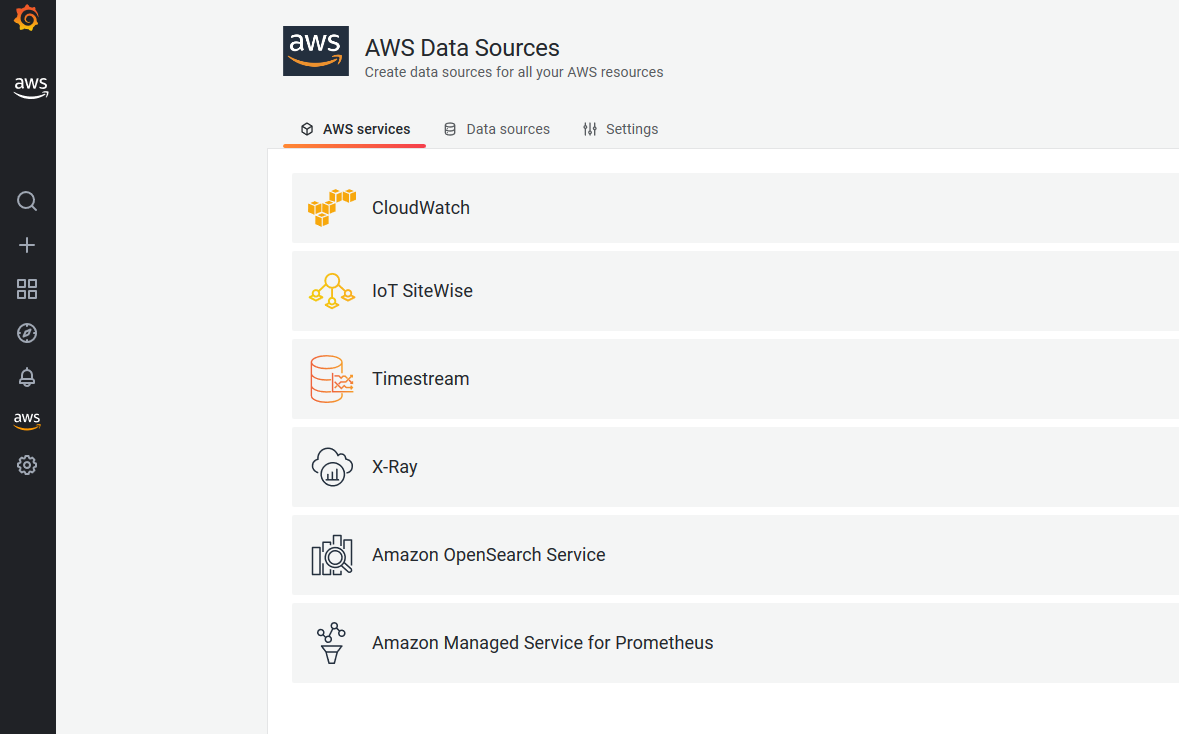
Select CloudWatch from the Service dropdown and select the AWS Region where the Yelb application is deployed:

Select Go to settings:

Configure CloudWatch data source

  • For Name, use CloudWatchDataSource (or a name you choose).
  • For Assume Role ARN, add the ARN of AMGCloudWatchDataSourceRole from environment variable AMGCloudWatchDataSourceRoleARN.
  • Choose the Region where you created CloudWatch.
  • Add ContainerInsights/yelb for Namespace of Customer Metrics.
  • Select Save & test button, which should show Data source working.

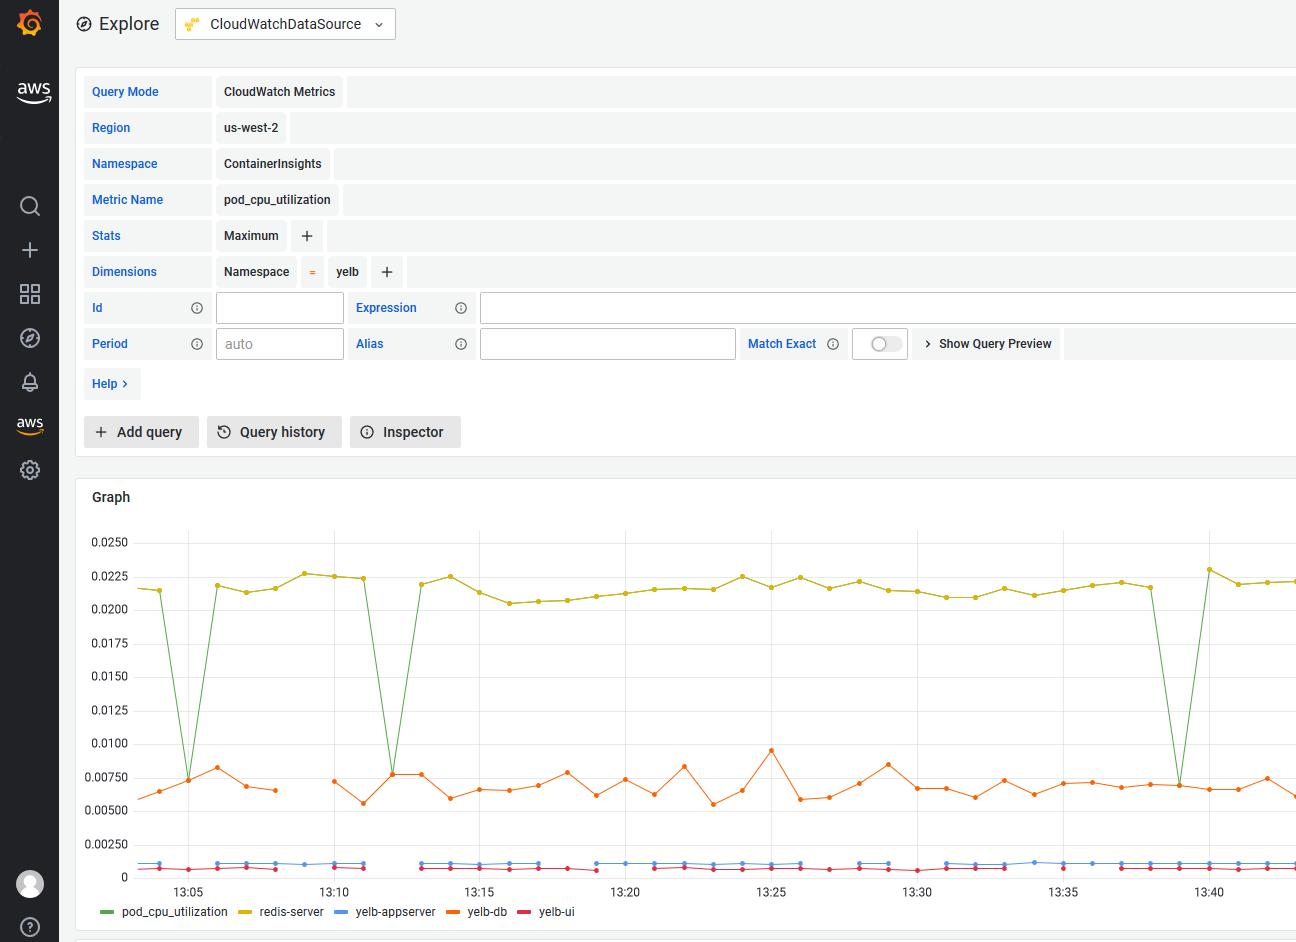
To use CloudWatchDataSource, you can use Explore. The CloudWatch data source can query data from both CloudWatch metrics and CloudWatch Logs APIs, each with its own specialized query editor. You select which API you want to query with using the query mode switch on top of the editor.

  • Ensure QueryMode is selected as CloudWatch Metrics.
  • Select ContainerInsights as Namespace.
  • Choose metrics from the Metric Name dropdown.
  • For Dimensions, select Namespace = yelb.
  • Disable the Match exact option.
  • Select Run Query.

When viewing CloudWatch Metrics in Amazon Managed Grafana, you will be shown a screen similar to the following:

When viewing CloudWatch Metrics in Amazon Managed Grafana, you will be shown a screen similar to this

Clean up

Use the following commands to clean up the Workload B cluster:

export AWS_PROFILE=workload-b
kubectl config use-context $WLDB_USER@$WLDB_EKS_CLUSTER_NAME.$WLDB_AWS_REGION.eksctl.io
curl -s https://raw.githubusercontent.com/aws-samples/amazon-cloudwatch-container-insights/latest/k8s-deployment-manifest-templates/deployment-mode/daemonset/container-insights-monitoring/quickstart/cwagent-fluentd-quickstart.yaml | sed "s/cluster_name/eksworkshop-eksctl/;s/region_name/${AWS_REGION}/" | kubectl delete -f -
aws iam detach-role-policy \
  --policy-arn arn:aws:iam::aws:policy/CloudWatchAgentServerPolicy \
  --role-name ${ROLE_NAME}

# Clean up policy and roles
WLB_CW_DATASOURCE_ROLE=AMGCloudWatchDataSourceRole 
WLB_CW_POLICY=AMGCloudWatchPermissionPolicy
aws iam delete-role-policy --role-name $WLB_CW_DATASOURCE_ROLE --policy-name $WLB_CW_POLICY
aws iam delete-role --role-name $WLB_CW_DATASOURCE_ROLE
rm -r amp_ingest_override_values.yaml
rm -f cw_permission_policy.json
rm -f cw_trust_policy.json

helm delete aws-load-balancer-controller -n kube-system
kubectl delete ns yelb 
eksctl delete cluster --name=WLDB_EKS_CLUSTER_NAME

Clean up Workload A:

export AWS_PROFILE=workload-a
kubectl config use-context $WLDA_USER@$WLDA_EKS_CLUSTER_NAME.$WLDA_AWS_REGION.eksctl.io
helm uninstall prometheus-for-amp -n prometheus
kubectl delete ns prometheus

# Clean up policy and roles
aws iam detach-role-policy --role-name $SERVICE_ACCOUNT_IAM_AMP_INGEST_ROLE --policy-arn $SERVICE_ACCOUNT_IAM_AMP_INGEST_ARN
aws iam delete-policy --policy-arn $SERVICE_ACCOUNT_IAM_AMP_INGEST_ARN
aws iam delete-role --role-name $SERVICE_ACCOUNT_IAM_AMP_INGEST_ROLE
WLA_PROM_DATASOURCE_ROLE=AMGPrometheusDataSourceRole
WLA_PROM_POLICY=AMGPrometheusPermissionPolicy
aws iam delete-role-policy --role-name $WLA_PROM_DATASOURCE_ROLE --policy-name $WLA_PROM_POLICY
aws iam delete-role --role-name $WLA_PROM_DATASOURCE_ROLE
rm -f amp_permission_policy.json 
rm -f amp_trust_policy.json

aws amp delete-workspace --workspace-id $WORKSPACE_ID
helm delete aws-load-balancer-controller -n kube-system
kubectl delete ns yelb 
eksctl delete cluster --name=WLDA_EKS_CLUSTER_NAME

In the Grafana account, navigate to the Amazon Managed Grafana service and delete the Amazon Managed Grafana workspace called cross-amg:

# Clean up policy and roles
export AWS_PROFILE=amg-account
AMG_WORKSPACE_ROLE=AMGWorkspaceRole 
AMG_WORKSPACE_POLICY=AMGWorkspacePermissionPolicy 
aws iam delete-role-policy --role-name $AMG_WORKSPACE_ROLE --policy-name $AMG_WORKSPACE_POLICY
aws iam delete-role --role-name $AMG_WORKSPACE_ROLE
rm -f amg_role_trust_policy.json 
rm -f amg_workspace_permission_policy.json

Conclusion

In this blog post, we demonstrated how to set up Amazon Managed Grafana to retrieve metrics from Amazon Managed Service for Prometheus and CloudWatch Container Insights from different AWS accounts running container workloads using customer managed IAM roles.

With Amazon Managed Grafana, you can use Grafana without the operational management of maintaining infrastructure resources, and let AWS take care of the undifferentiated heavy lifting.

Elamaran Shanmugam

Elamaran Shanmugam

Elamaran (Ela) Shanmugam is a Sr. Container Specialist Solutions Architect with AWS. Ela is a Container, Observability and Multi-Account Architecture SME and helps customers design and build scalable, secure and optimized container workloads on AWS. His passion is building and automating infrastructure to allow customers to focus more on their business. He is based out of Tampa, Florida and you can reach him on twitter @IamElaShan.

Munish Dabra

Munish Dabra

Munish Dabra is a Principal Solutions Architect at Amazon Web Services (AWS). His current area of focus are AI/ML and Observability. He has a strong background in designing and building scalable distributed systems. He enjoys helping customers innovate and transform their businesses on AWS. LinkedIn: /mdabra