AWS Open Source Blog

Performing canary deployments and metrics-driven rollback with Amazon Managed Service for Prometheus and Flagger

This post was written by Kevin Bell and Stefan Prodan.

Canary deployments are a popular tool to reduce risk when deploying software, by exposing a new version to a small subset of traffic before rolling it out more broadly. Creating the machinery to do this kind of controlled rollout, and monitoring for possible problems and rolling back if necessary, can be difficult. Flagger is a CNCF incubating project that takes care of much of the undifferentiated heavy lifting of canary deployments on Kubernetes. It supports blue/green canary deployments, and even A/B testing for a number of ingress controllers and service meshes. Additionally, Flagger works with CI/CD tools that deploy to Kubernetes, as it kicks off each canary rollout once a deployment resource has been updated in the Kubernetes API Server.

In this post, we explain how to perform canary deployments on Kubernetes using Flagger to orchestrate the rollout, promotion, and rollback of deployments. We take advantage of Flagger’s built-in Prometheus support to use Amazon Managed Service for Prometheus, a Prometheus-compatible monitoring service, to handle metrics. Also, we use its integration with AWS App Mesh for traffic control. Finally, we show how to observe the canary deployment process with Amazon Managed Grafana, a fully managed service for open source Grafana developed in collaboration with Grafana Labs, using the pre-created Grafana dashboards provided by the Flagger project.

Overview

The following diagram demonstrates the high-level interaction between each component discussed in the post. During a deployment, the numbered arrows show how all the components work together to create a feedback cycle to govern the rollout process.

diagram demonstrates the high-level interaction between each component discussed in the post. During a deployment, the numbered arrows show how all the components work together to create a feedback cycle to govern the rollout process.

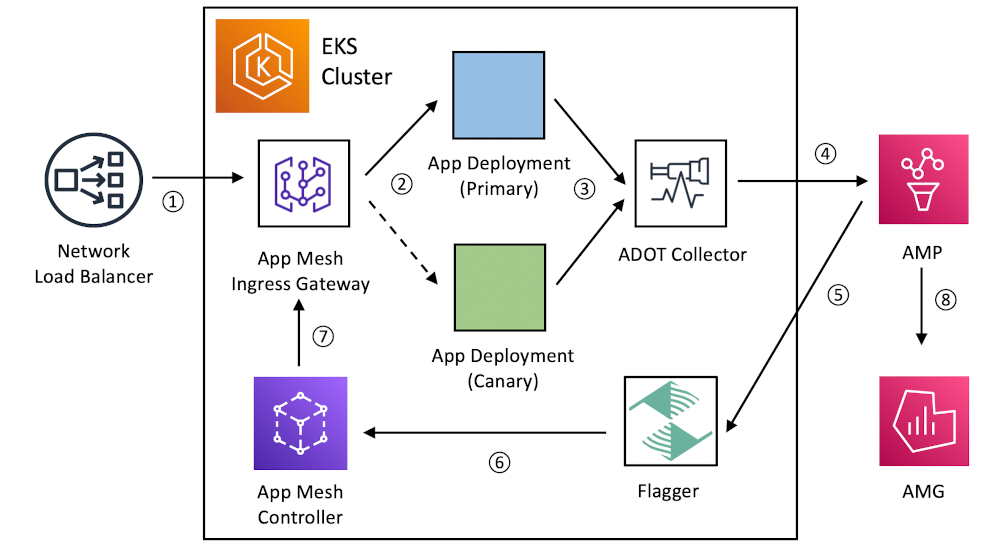
Let’s briefly walk through each step in the process:

  1. Traffic arrives from the internet at a Network Load Balancer, and is sent to the App Mesh Ingress Gateway, composed of a Kubernetes deployment of Envoy proxies.
  2. According to the weights configured in App Mesh, traffic is distributed between the primary and canary application versions, starting with a small percentage.
  3. The AWS Distro for OpenTelemetry Collector, deployed as a DaemonSet, collects metrics about the behavior of both primary and canary versions. In the example, we will use metrics from the Envoy proxy sidecars deployed by App Mesh to monitor basic stats, such as HTTP status codes, but it is possible to use metrics from any Prometheus exporter.
  4. Metrics are sent to Amazon Managed Service for Prometheus using the Prometheus remote write API.
  5. Metrics are monitored by Flagger through the Prometheus query API.
  6. If the metrics are within specified thresholds, Flagger updates App Mesh custom resource definitions (CRDs) in the Kubernetes API server, which the App Mesh Controller will propagate to the service mesh.
  7. The Envoy proxies in the App Mesh Ingress Gateway will receive updated configuration from App Mesh, causing them to shift more traffic to the canary version.
  8. Throughout the process, all metrics can be monitored and visualized in Amazon Managed Grafana.

Now that we know what the end state will be like, let’s walk through the steps for setting up a complete example.

Prerequisites

Before beginning, the following must be installed:

We will use a Bash shell, which is available on macOS and Linux, but the specific commands required will be different on Windows.

Walkthrough

Launch an Amazon EKS cluster

For this walkthrough, we will be working in the us-east-1 Region, which is one of many Regions in which all required services are available. First, we will prepare a configuration file for use with eksctl, and then we can launch an Amazon Elastic Kubernetes Service (Amazon EKS) cluster with the necessary AWS infrastructure. We will conclude this step by installing the App Mesh Controller and creating a mesh to enable traffic shifting.

Let’s create an AWS Identity and Access Management (IAM) policy for the AWS Distro for OpenTelemetry Collector to access Amazon Managed Service for Prometheus:

cat <<EOF > PermissionPolicyIngest.json
{"Version": "2012-10-17",
   "Statement": [
       {"Effect": "Allow",
        "Action": [
           "aps:RemoteWrite", 
           "aps:GetSeries", 
           "aps:GetLabels",
           "aps:GetMetricMetadata"
        ], 
        "Resource": "*"
      }
   ]
}
EOF
INGEST_POLICY_ARN=$(aws iam create-policy --policy-name AMPIngest \
--policy-document file://PermissionPolicyIngest.json \
--query 'Policy.Arn' --output text)

Prepare a configuration file for eksctl:

cat <<EOF > cluster.yaml
apiVersion: eksctl.io/v1alpha5
kind: ClusterConfig
metadata:
  name: mycluster
  version: "1.21"
  region: us-east-1
managedNodeGroups:
- name: managed-ng-1
  instanceType: t3.medium
  minSize: 1
  maxSize: 2
  desiredCapacity: 2
  iam:
    attachPolicyARNs:
    - "arn:aws:iam::aws:policy/AmazonEKSWorkerNodePolicy"
    - "arn:aws:iam::aws:policy/AmazonEKS_CNI_Policy"
    - "arn:aws:iam::aws:policy/AmazonEC2ContainerRegistryReadOnly"
    - "arn:aws:iam::aws:policy/AWSAppMeshEnvoyAccess"
iam:
  withOIDC: true
  serviceAccounts:
  - metadata:
      name: appmesh-controller
      namespace: appmesh-system
    attachPolicyARNs:
    - "arn:aws:iam::aws:policy/AWSCloudMapFullAccess"
    - "arn:aws:iam::aws:policy/AWSAppMeshFullAccess"
  - metadata:
      name: amp-iamproxy-ingest-service-account
      namespace: adot-col
    attachPolicyARNs:
    - "$INGEST_POLICY_ARN"
  - metadata:
      name: flagger-service-account
      namespace: flagger-system
    attachPolicyARNs:
    - "arn:aws:iam::aws:policy/AmazonPrometheusQueryAccess"
EOF

Launch the cluster, which will take a few minutes. Note that both the Namespaces and ServiceAccounts specified in the configuration file will be precreated in the cluster:

eksctl create cluster -f cluster.yaml

List nodes to make sure that the cluster is accessible:

kubectl get nodes

Once the cluster is available, install the required App Mesh Controller:

kubectl apply -k github.com/aws/eks-charts/stable/appmesh-controller//crds?ref=master
helm repo add eks https://aws.github.io/eks-charts
helm repo update
helm upgrade -i appmesh-controller eks/appmesh-controller \
    --namespace appmesh-system \
    --set region=us-east-1 \
    --set serviceAccount.create=false \
    --set serviceAccount.name=appmesh-controller

Create a mesh:

cat << EOF | kubectl apply -f -
apiVersion: appmesh.k8s.aws/v1beta2
kind: Mesh
metadata:
  name: global
spec:
  namespaceSelector:
    matchLabels:
      appmesh.k8s.aws/sidecarInjectorWebhook: enabled
EOF

Confirm that the mesh appears as expected in the App Mesh service. We should see output showing active status:

aws appmesh describe-mesh --mesh-name global

Set up Amazon Managed Service for Prometheus

Now that the Amazon EKS cluster is ready, we can set up Amazon Managed Service for Prometheus and related tools to enable the canary deployment process. This will include installing the AWS Distro for OpenTelemetry Collector using the OpenTelemetry Operator, enabling the scrape configurations needed to collect metrics for Flagger, and configuring Amazon Managed Service for Prometheus as a remote write endpoint.

Let’s start by creating an Amazon Managed Service for Prometheus workspace:

WORKSPACE_ID=$(aws amp create-workspace --alias myworkspace \
 --query workspaceId --output text)

Now wait for the workspace to have an active status, as shown by this command:

aws amp describe-workspace --workspace-id $WORKSPACE_ID

Next we can install the OpenTelemetry Operator and cert-manager, on which it depends:

helm repo add jetstack https://charts.jetstack.io
helm repo update
kubectl apply -f https://github.com/jetstack/cert-manager/releases/download/v1.4.0/cert-manager.crds.yaml
helm install cert-manager jetstack/cert-manager \
  --namespace cert-manager --create-namespace --version v1.4.0
helm repo add open-telemetry https://open-telemetry.github.io/opentelemetry-helm-charts
helm repo update
helm install opentelemetry-operator open-telemetry/opentelemetry-operator

Check that it was installed correctly:

kubectl get pod -n opentelemetry-operator-system

We should be shown something like the following:

NAME                                                         READY   STATUS    RESTARTS   AGE
opentelemetry-operator-controller-manager-74fb5cd456-x89l4   2/2     Running   0          94m

Now that the operator is deployed, we can create the AWS Distro for OpenTelemetry Collector instance. Let’s start by getting the Prometheus endpoint to write to:

PROM_ENDPOINT=$(aws amp describe-workspace --workspace-id $WORKSPACE_ID \
  --query 'workspace.prometheusEndpoint' --output text)

Now let’s give the precreated AWS Distro for OpenTelemetry Collector Service Account permission to access various metrics resources:

kubectl apply -f - <<EOF
kind: ClusterRole
apiVersion: rbac.authorization.k8s.io/v1
metadata:
  name: adotcol-admin-role
rules:
  - apiGroups: [""]
    resources:
    - nodes
    - nodes/proxy
    - services
    - endpoints
    - pods
    verbs: ["get", "list", "watch"]
  - apiGroups:
    - extensions
    resources:
    - ingresses
    verbs: ["get", "list", "watch"]
  - nonResourceURLs: ["/metrics"]
    verbs: ["get"]
---
kind: ClusterRoleBinding
apiVersion: rbac.authorization.k8s.io/v1
metadata:
  name: adotcol-admin-role-binding
subjects:
  - kind: ServiceAccount
    name: amp-iamproxy-ingest-service-account
    namespace: adot-col
roleRef:
  kind: ClusterRole
  name: adotcol-admin-role
  apiGroup: rbac.authorization.k8s.io
EOF

Then we can create the AWS Distro for OpenTelemetry Collector instance:

kubectl apply -f - <<EOF
kind: OpenTelemetryCollector
apiVersion: opentelemetry.io/v1alpha1
metadata:
  name: my-collector
  namespace: adot-col
spec:
  image: "public.ecr.aws/aws-observability/aws-otel-collector:v0.11.0"
  serviceAccount: amp-iamproxy-ingest-service-account
  mode: daemonset
  config: |
    receivers:
      prometheus:
        config:
          global:
            scrape_interval: 15s
            scrape_timeout: 10s
          scrape_configs:
          - job_name: 'appmesh-envoy'
            metrics_path: /stats/prometheus
            kubernetes_sd_configs:
            - role: pod
            relabel_configs:
            - source_labels: [__meta_kubernetes_pod_container_name]
              action: keep
              regex: '^envoy$'
            - source_labels: [__address__, __meta_kubernetes_pod_annotation_prometheus_io_port]
              action: replace
              regex: ([^:]+)(?::\d+)?;(\d+)
              replacement: \$\${1}:9901
              target_label: __address__
            - action: labelmap
              regex: __meta_kubernetes_pod_label_(.+)
            - source_labels: [__meta_kubernetes_namespace]
              action: replace
              target_label: kubernetes_namespace
            - source_labels: [__meta_kubernetes_pod_name]
              action: replace
              target_label: kubernetes_pod_name
            # Exclude high cardinality metrics
            metric_relabel_configs:
            - source_labels: [ cluster_name ]
              regex: '(outbound|inbound|prometheus_stats).*'
              action: drop
            - source_labels: [ tcp_prefix ]
              regex: '(outbound|inbound|prometheus_stats).*'
              action: drop
            - source_labels: [ listener_address ]
              regex: '(.+)'
              action: drop
            - source_labels: [ http_conn_manager_listener_prefix ]
              regex: '(.+)'
              action: drop
            - source_labels: [ http_conn_manager_prefix ]
              regex: '(.+)'
              action: drop
            - source_labels: [ __name__ ]
              regex: 'envoy_tls.*'
              action: drop
            - source_labels: [ __name__ ]
              regex: 'envoy_tcp_downstream.*'
              action: drop
            - source_labels: [ __name__ ]
              regex: 'envoy_http_(stats|admin).*'
              action: drop
            - source_labels: [ __name__ ]
              regex: 'envoy_cluster_(lb|retry|bind|internal|max|original).*'
              action: drop
          - job_name: 'kubernetes-cadvisor'
            scheme: https
            tls_config:
              ca_file: /var/run/secrets/kubernetes.io/serviceaccount/ca.crt
            bearer_token_file: /var/run/secrets/kubernetes.io/serviceaccount/token
            kubernetes_sd_configs:
            - role: node
            relabel_configs:
            - action: labelmap
              regex: __meta_kubernetes_node_label_(.+)
            - target_label: __address__
              replacement: kubernetes.default.svc:443
            - source_labels: [__meta_kubernetes_node_name]
              regex: (.+)
              target_label: __metrics_path__
              replacement: /api/v1/nodes/\$\${1}/proxy/metrics/cadvisor
          - job_name: 'kubernetes-apiservers'
            kubernetes_sd_configs:
            - role: endpoints
              namespaces:
                names:
                - default
            scheme: https
            tls_config:
              ca_file: /var/run/secrets/kubernetes.io/serviceaccount/ca.crt
            bearer_token_file: /var/run/secrets/kubernetes.io/serviceaccount/token
            relabel_configs:
            - source_labels: [__meta_kubernetes_service_name, __meta_kubernetes_endpoint_port_name]
              action: keep
              regex: kubernetes;https
    exporters:
      awsprometheusremotewrite:
        endpoint: "${PROM_ENDPOINT}api/v1/remote_write"
        aws_auth:
          region: "us-east-1"
          service: "aps"
      logging:
        loglevel: debug
    extensions:
      health_check:
      pprof:
        endpoint: :1888
      zpages:
        endpoint: :55679
    service:
      extensions: [pprof, zpages, health_check]
      pipelines:
        metrics:
          receivers: [prometheus]
          exporters: [logging, awsprometheusremotewrite]
EOF

Confirm that metrics are being collected by doing a test query with awscurl:

awscurl --service="aps" --region="us-east-1" \
  "${PROM_ENDPOINT}api/v1/query?query=kubernetes_build_info"

A non-empty result shows that metrics are being collected from the cluster. The result should contain data in the result field:

{"status":"success","data":{"resultType":"vector","result":[...this should not be empty...]}}

Set up Amazon Managed Grafana (optional)

Amazon Managed Grafana provides advanced metric visualization and alerting on top of the data stored in Amazon Managed Service for Prometheus, and it will help us observe the canary deployment process. Note that Amazon Managed Grafana requires that either AWS Single Sign-On or another SAML IdP be available for authentication. Setting up Amazon Managed Grafana is not required by Flagger.

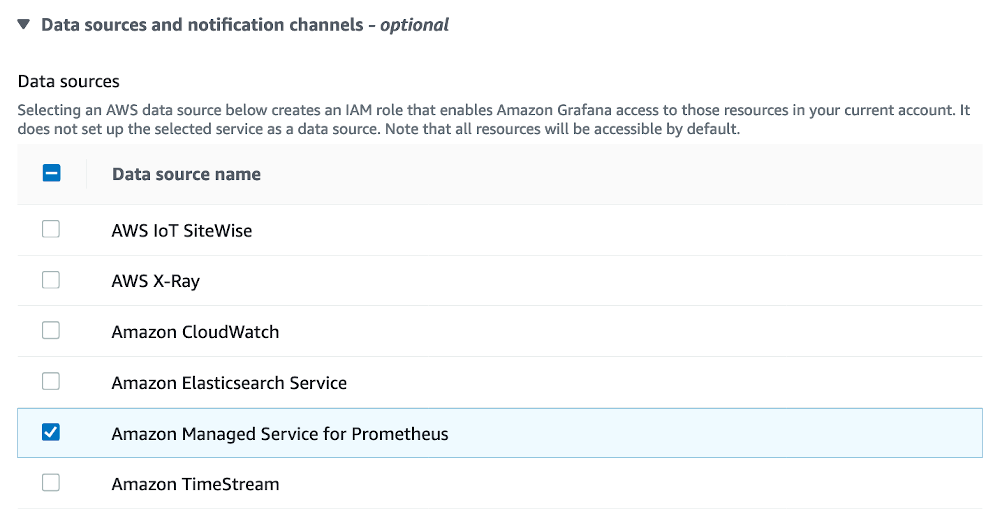
Let’s walk through the steps in the documentation for getting started with Amazon Managed Grafana, making sure to select the option to enable Amazon Managed Prometheus as a data source.

screenshot of data sources with Amazon Managed Service for Prometheus selected

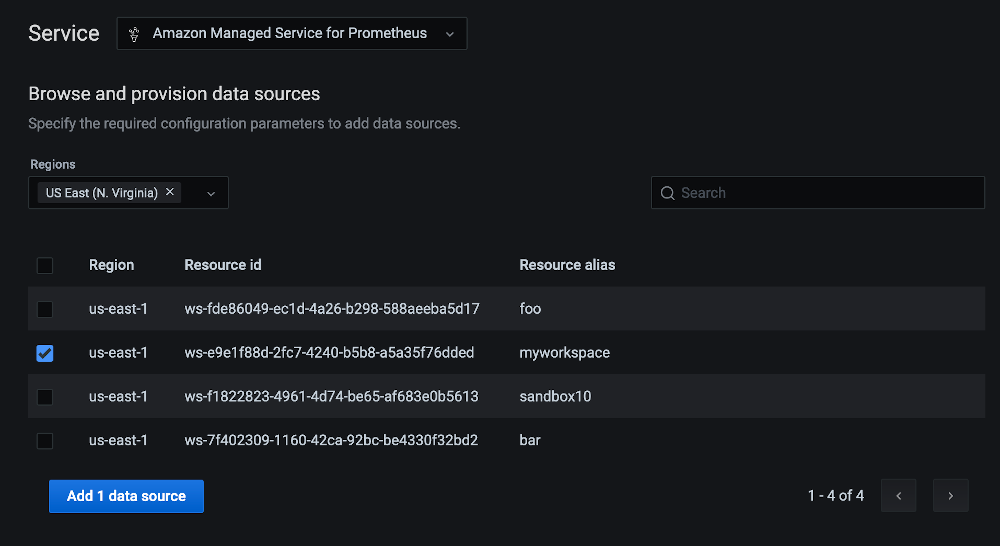
Next we will add Amazon Managed Service for Prometheus as a data source as described in the Amazon Managed Grafana documentation. Let’s select the us-east-1 Region and the same Amazon Managed Service for Prometheus workspace we created previously:

us-east-1 Region selected

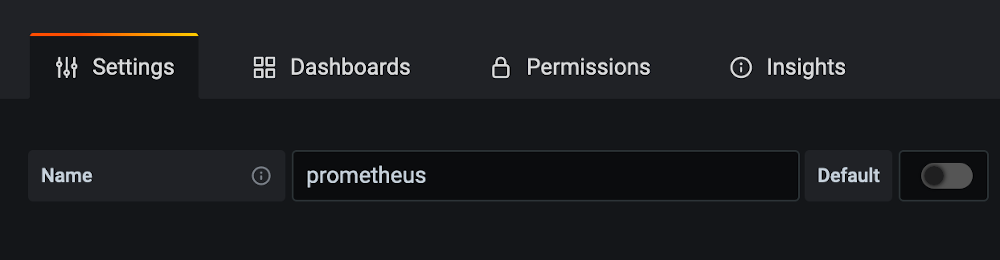
Next, in Settings rename the data source to prometheus. This will help when importing a premade dashboard later:

prometheus in the name field

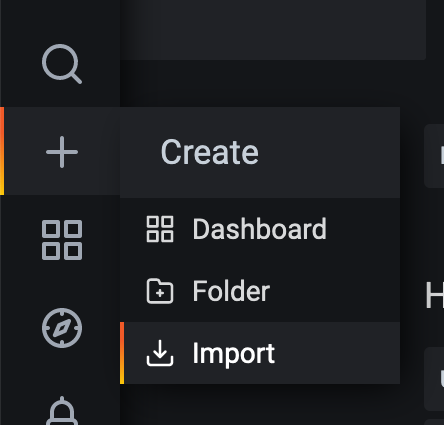
Finally, let’s import a precreated dashboard from the Flagger project by selecting the + icon and Import:

screenshot of import option

Then we can add the JSON config from the Flagger project and choose Save. The dashboard won’t show much yet, but we will come back to it soon.

Install Flagger

Now we’re ready to install Flagger. First we must install the AWS SIGv4 Proxy Admission Controller to allow Flagger to authenticate with Amazon Managed Service for Prometheus via IAM.

Install the admission controller:

helm upgrade -i aws-sigv4-proxy-admission-controller \
    eks/aws-sigv4-proxy-admission-controller \
    --namespace kube-system

To simplify Helm configuration, create a values file:

cat <<EOF > values.yaml
podAnnotations:
  appmesh.k8s.aws/sidecarInjectorWebhook: disabled
  sidecar.aws.signing-proxy/inject: "true"
  sidecar.aws.signing-proxy/host: "aps-workspaces.us-east-1.amazonaws.com"
  sidecar.aws.signing-proxy/name: aps
metricsServer: "http://localhost:8005/workspaces/$WORKSPACE_ID"
meshProvider: "appmesh:v1beta2"
serviceAccount:
  create: false
  name: flagger-service-account
EOF

Then install Flagger:

helm repo add flagger https://flagger.app
helm repo update
kubectl apply -f https://raw.githubusercontent.com/fluxcd/flagger/main/artifacts/flagger/crd.yaml
helm upgrade -i flagger flagger/flagger \
  --namespace=flagger-system \
  -f values.yaml

Check that Flagger is installed and running:

kubectl get pods -n flagger-system

We should get output like the following. (Note that there are two containers in the pod—Flagger and the sigv4 proxy sidecar.)

NAME                      READY   STATUS    RESTARTS   AGE
flagger-77c65ff87-ftwbm   2/2     Running   0          20s

Deploy the sample app

Now that the cluster, metrics infrastructure, and Flagger are installed, we can install the sample application itself. We will use the standard Podinfo application used in the Flagger project and the accompanying loadtester tool. We also will create the Canary API resource that defines the rollout. We will use a minimal canary configuration. Find details on how to configure Flagger Canaries in the Flagger documentation.

First, let’s create a Namespace called test and enable App Mesh in it:

cat << EOF | kubectl apply -f -
apiVersion: v1
kind: Namespace
metadata:
  name: test
  labels:
    appmesh.k8s.aws/sidecarInjectorWebhook: enabled
EOF

Install the sample application:

helm upgrade -i podinfo flagger/podinfo \
  --namespace test \
  --set hpa.enabled=false

Install the loadtester:

helm upgrade -i flagger-loadtester flagger/loadtester \
  --namespace=test \
  --set appmesh.enabled=true \
  --set "appmesh.backends[0]=podinfo" \
  --set "appmesh.backends[1]=podinfo-canary"

Create the Canary resource:

cat <<EOF | kubectl apply -f -
apiVersion: flagger.app/v1beta1
kind: Canary
metadata:
  name: podinfo
  namespace: test
spec:
  provider: appmesh:v1beta2
  targetRef:
    apiVersion: apps/v1
    kind: Deployment
    name: podinfo
  progressDeadlineSeconds: 60
  service:
    port: 9898
  analysis:
    interval: 1m
    # max number of failed metric checks before rollback
    threshold: 5
    # canary increment step percentages (0-100)
    stepWeights: [2,5,10,20,30,50]
    metrics:
    - name: request-success-rate
      thresholdRange:
        min: 99
      interval: 1m
EOF

Finally, install the App Mesh Gateway and create a gateway route:

helm upgrade -i appmesh-gateway eks/appmesh-gateway \
  --namespace test
cat << EOF | kubectl apply -f -
apiVersion: appmesh.k8s.aws/v1beta2
kind: GatewayRoute
metadata:
  name: podinfo
  namespace: test
spec:
  httpRoute:
    match:
      prefix: "/"
    action:
      target:
        virtualService:
          virtualServiceRef:
            name: podinfo
EOF

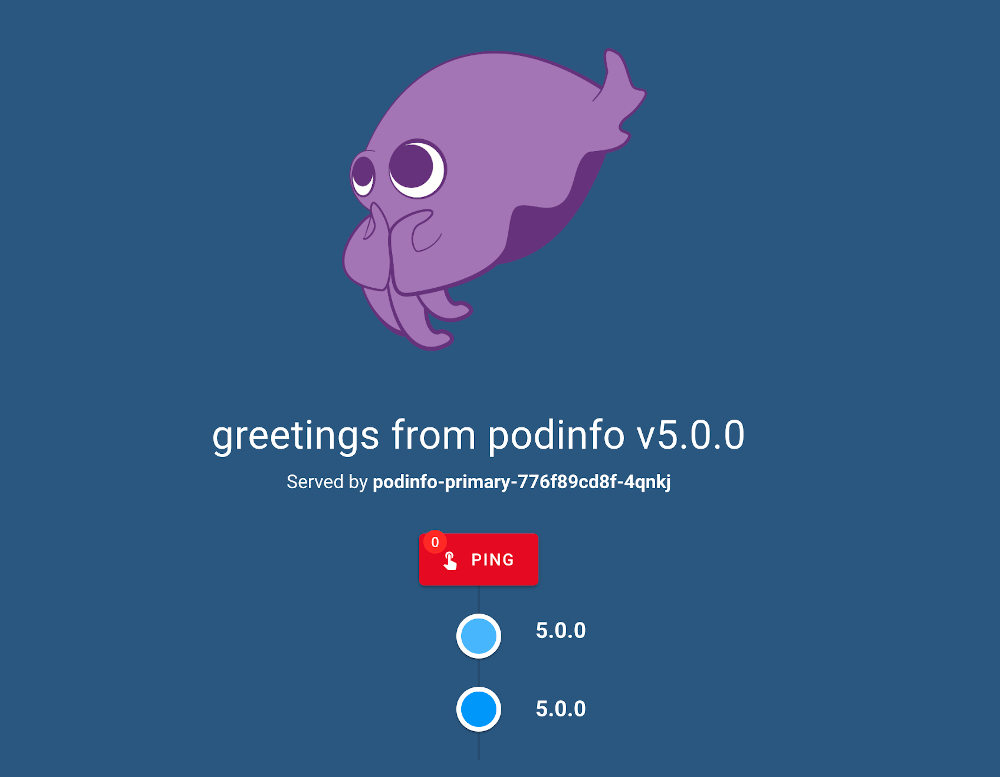
Once the load balancer is provisioned and health checks pass, we can find the sample application at the load balancer’s public address:

kubectl get svc -n test --field-selector 'metadata.name==appmesh-gateway' \
  -o=jsonpath='{.items[0].status.loadBalancer.ingress[0].hostname}{"\n"}'

It should look something like the following:

landing page for greetings from podinfo v5.0.0

Test canary deployment

Now that both Flagger and the sample app are deployed, we can experience how canary rollout (and rollback) works in action.

First, let’s trigger an update to the Podinfo deployment and watch it be promoted successfully. Then, let’s make another change and force the canary checks to fail, causing a rollback.

Start by making a trivial change to the PodSpec:

kubectl -n test set image deployment/podinfo \
    podinfo=stefanprodan/podinfo:5.0.1

Then make sure that some load is applied to the Podinfo app, split between canary and primary according to the rollout process. This command will run for a while without producing output while generating traffic:

kubectl -n test exec -it deploy/flagger-loadtester \
  -- hey -z 30m -c 2 -q 20 http://podinfo.test:9898

Then we can watch for new events on the Canary resource in another shell:

kubectl get event --namespace test --field-selector involvedObject.kind=Canary -w

We are shown the following as the rollout progresses:

LAST SEEN   TYPE     REASON   OBJECT           MESSAGE
0s          Normal   Synced   canary/podinfo   New revision detected! Scaling up podinfo.test
0s          Normal   Synced   canary/podinfo   Starting canary analysis for podinfo.test
0s          Normal   Synced   canary/podinfo   Advance podinfo.test canary weight 2
0s          Normal   Synced   canary/podinfo   Advance podinfo.test canary weight 5
0s          Normal   Synced   canary/podinfo   Advance podinfo.test canary weight 10
0s          Normal   Synced   canary/podinfo   Advance podinfo.test canary weight 20
0s          Normal   Synced   canary/podinfo   Advance podinfo.test canary weight 50
0s          Normal   Synced   canary/podinfo   Copying podinfo.test template spec to podinfo-primary.test
0s          Normal   Synced   canary/podinfo   Routing all traffic to primary
0s          Normal   Synced   canary/podinfo   Promotion completed! Scaling down podinfo.test

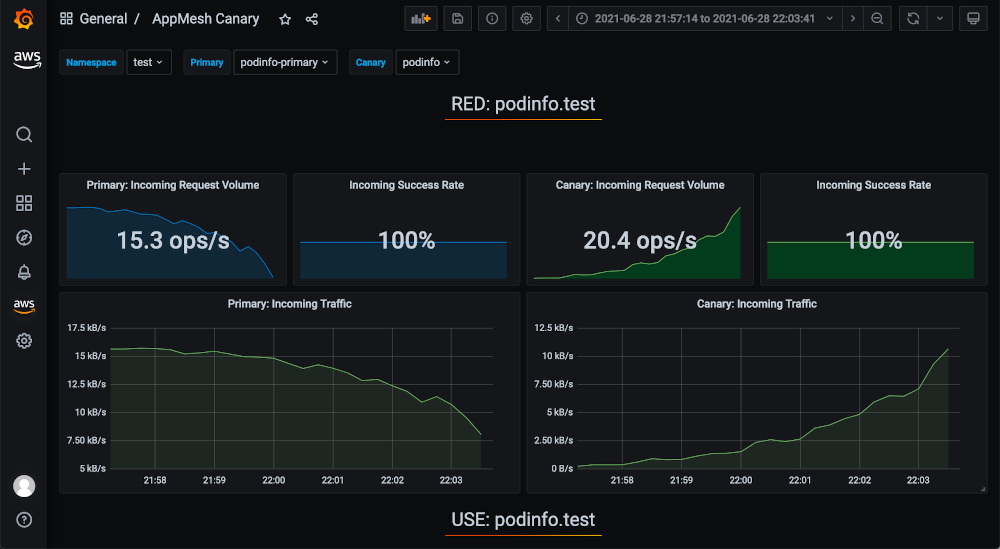
Now if we go back to the AppMesh Canary dashboard we imported into Amazon Managed Grafana, we are shown graphs of the metrics used by Flagger. Note the increasing canary traffic over time. We may need to refresh the page and confirm that the values selected for Namespace/Primary/Canary are “test”/”podinfo-primary”/”podinfo” respectively:

screenshot from Grafana showing blue-green deployment

Let’s repeat the process one more time:

kubectl -n test set image deployment/podinfo \
    podinfo=stefanprodan/podinfo:5.0.2

Apply load again:

kubectl -n test exec -it deploy/flagger-loadtester \
  -- hey -z 30m -c 2 -q 20 http://podinfo.test:9898

But this time let’s wreak some havoc on the Prometheus metrics for the canary in a separate shell:

kubectl -n test exec -it deploy/flagger-loadtester \
  -- hey -z 30m -c 1 -q 5 http://podinfo-canary.test:9898/status/500

When we monitor canary events again, we are shown warnings like the following, and the rollout ultimately fails:

LAST SEEN   TYPE     REASON   OBJECT           MESSAGE
0s          Normal   Synced   canary/podinfo   New revision detected! Scaling up podinfo.test
0s          Normal   Synced   canary/podinfo   Starting canary analysis for podinfo.test
0s          Normal   Synced   canary/podinfo   Advance podinfo.test canary weight 2
0s          Normal   Synced   canary/podinfo   Advance podinfo.test canary weight 5
0s          Normal   Synced   canary/podinfo   Advance podinfo.test canary weight 10
0s          Warning  Synced   canary/podinfo   Halt podinfo.test advancement success rate 46.04% < 99%
0s          Warning  Synced   canary/podinfo   Halt podinfo.test advancement success rate 64.85% < 99%
[...abridged...]
0s          Warning  Synced   canary/podinfo   Rolling back podinfo.test failed checks threshold reached 5
0s          Warning  Synced   canary/podinfo   Canary failed! Scaling down podinfo.test

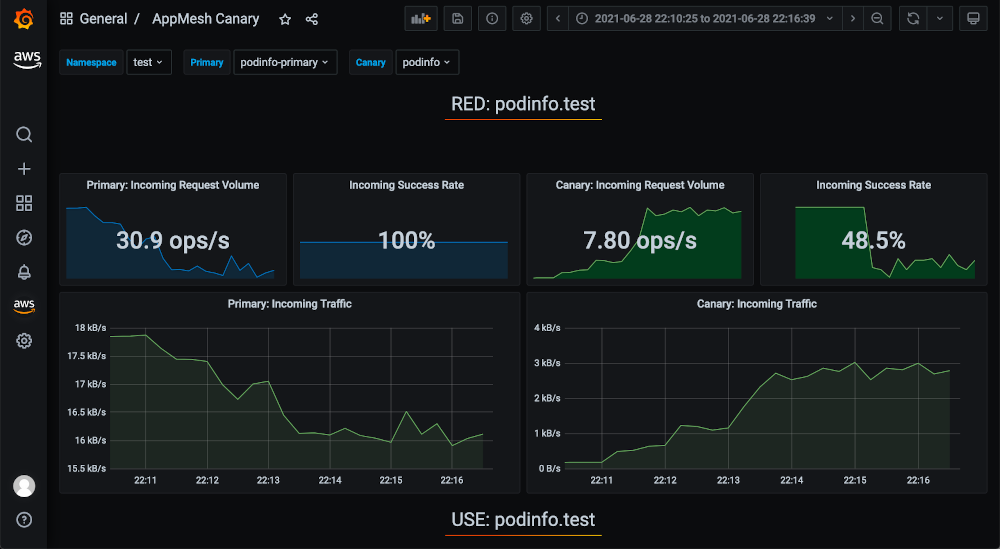
Again, we can view the corresponding metrics in Amazon Managed Grafana, including the decrease in success rate on the canary that caused the rollout to fail:

screenshot from Grafana showing a failed deployment

This shows how Flagger can safely roll out healthy new versions and prevent the release of versions containing errors detectable by Prometheus metrics.

Cleanup

Now that we are done trying out everything, let’s walk through deleting all the resources used.

Start with the Kubernetes resources that need to be deleted to clean up associated App Mesh resources:

kubectl delete ns test
kubectl delete mesh global

Then, using eksctl, delete the Amazon EKS cluster:

eksctl delete cluster mycluster

Clean up the Amazon Managed Service for Prometheus workspace and ingest policy:

aws amp delete-workspace --workspace-id $WORKSPACE_ID
aws iam delete-policy --policy-arn $INGEST_POLICY_ARN

Refer to the documentation to delete the Amazon Managed Grafana workspace in the AWS Management Console.

Conclusion

This post explained the process for setting up and using Flagger for canary deployments together with Amazon EKS, Amazon Managed Service for Prometheus, Amazon Managed Grafana, and AWS App Mesh. We only scratched the surface of what’s possible with canary deployment and metrics-driven rollback, but we hope this helps show the value that canary rollouts provide.

Beyond what was covered in this post, you can also consider Flagger’s Slack integration and webhook notifications for failed canary deployments. Amazon Managed Grafana also allows you to alert on a wide variety of metrics data and supports notifying an Amazon Simple Notification Service (Amazon SNS) topic as well as Slack, PagerDuty, and more.

To learn more, read the Amazon Builders’ Library post about automating safe, hands-off deployments, which discusses how we gradually deploy to production at AWS to minimize risk. You can also check out the Flagger hands-on guide that includes additional Weaveworks tools for GitOps.

Stefan Prodan

Stefan Prodan

Stefan Prodan is a Developer Experience engineer at Weaveworks and an open source contributor to cloud-native projects like Flagger, FluxCD, Helm Operator, SMI and others. He worked as a software architect and a DevOps consultant, helping companies embrace DevOps and the SRE movement. Stefan has over 15 years of experience with software development and he enjoys programming in Go and writing about distributed.

Kevin Bell

Kevin Bell

Kevin Bell is a Sr. Solutions Architect at AWS based in Seattle. He has been building things in the cloud for about 10 years. You can find him online as @bellkev on GitHub.