
Last week, AWS announced the beta release of AWS Lambda Powertools Typescript. This is a suite of TypeScript utilities for AWS Lambda functions to enable the adoption of best practices in areas such as structured logging, tracing and custom metrics. It follows on the back of the existing AWS Lambda Powertools Python and AWS Lambda Powertools Java libraries which have been hugely popular.
Over the past few years, serverless architectures on AWS have converged upon multiple individual AWS Lambda functions, with each one implementing least privilege and responsible for one task (single responsibility principle). This is great from a security, testing and availability perspective, but meant duplicating boiler plate code in each function.
The next natural step was to look at middleware such as Middy to decorate the main business logic, and allow these tasks to be defined once and used consistently. I remember listening to a Comic Relief talk about their Lambda wrapper back in 2019. Since then, I was introduced by Yan Cui to DAZN Lambda Powertools, which was the inspiration for this new project.
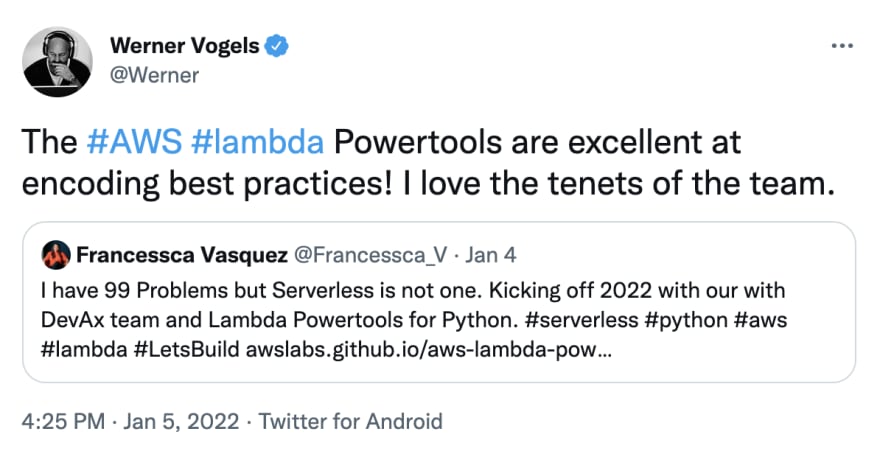
These tools both used Middy, but provide an opinionated view on top of standards to be adopted. What I love about the AWS Lambda Powertools is this it allows a new project to be stood up, that conforms to the best practices as set out in the Serverless Lens of the Well Architected Framework. This is a view shared by many in AWS including Francessca Vasquez and Werner Vogels
This initial release of the AWS Lambda Powertools Typescript provides features around:
- Logging
- Tracing
- Metrics
My goal was to take an existing Nodejs serverless prototype, and implement these features to see what value I get out of them. To start with, I decided to use Middy middleware to provide some additional benefits.
This meant installing the core module
npm install --save @middy/core
and wrapping the existing function handler in the middy() factory function
const middy = require('@middy/core');

const handler = async (event) => {
    ...
};

module.exports.handler = middy(handler);
Now we were reading to start adding the new features.
Logging
The Logger provides an opinionated logger with output structures as JSON.
The first step was to install the library:
npm install @aws-lambda-powertools/logger
The library requires a log level and a service name to be set. I was setting these using environment variables. In the provider section of the serverless.yml file, I set the following environment variables that would be applied to all functions defined:
- LOG_LEVEL - sets how minimum level that will be output
- LOGGER_SAMPLE_RATE - this was set to 0.2 meaning that 20% of all logs will be output, including debug. This sampling decision gets made at the initialisation of the Logger
Each individual function then had a service name defined:
provider:
  name: aws
  runtime: nodejs14.x
  ...
  environment:
    LOG_LEVEL: WARN
    POWERTOOLS_LOGGER_SAMPLE_RATE: 0.2

functions:
  createLicence:
    ...
    environment:
      POWERTOOLS_SERVICE_NAME: createLicence
Each Lambda function was instrumented as follows:
const { Logger, injectLambdaContext } = require('@aws-lambda-powertools/logger');
const middy = require('@middy/core');

//  Params fetched from the env vars
const logger = new Logger();

const handler = async (event) => {
    logger.debug(...)
};

module.exports.handler = middy(handler)
  .use(injectLambdaContext(logger));
The injectLambdaContext enriches the structured logs with key Lambda context information. This meant all my logs in CloudWatch used the following JSON format:
{
    "cold_start": true,
    "function_arn": "arn:aws:lambda:eu-west-1:{account-id}:function:create-licence-dev",
    "function_memory_size": 512,
    "function_name": "create-licence-dev",
    "function_request_id": "5e3298ed-e7d2-483a-a775-67c70927ad5d",
    "level": "DEBUG",
    "message": "In the create licence handler",
    "service": "qldb-simple-demo",
    "timestamp": "2022-01-08T13:40:59.640Z"
}
This is incredibly rich, and also meant I could use simple queries in CloudWatch Logs Insights such as
stats count(*) by cold_start
to show the number of cold starts vs non-cold starts and then start grouping by time
Tracer
Tracer is an 'opinionated thin wrapper' around AWS X-Ray.
The first step again was to install the library:
npm install @aws-lambda-powertools/tracer
Next, each Lambda function needs permission to send traces to X-Ray. I did this at the provider level in the serverless.yml file as follows:
provider:
  tracing:
    apiGateway: true
    lambda: true
  iam:
    role:
      statements:
        - Effect: Allow
          Action:
            - 'qldb:SendCommand'
          Resource:
            - !Sub "arn:aws:qldb:${AWS::Region}:${AWS::AccountId}:ledger/qldb-simple-demo-${self:provider.stage}"
        - Effect: "Allow"
          Action:
            - "xray:PutTraceSegments"
            - "xray:PutTelemetryRecords"
          Resource: "*"
The skeleton of each Lambda function is shown below. The tracer library requires a Service Name value, and this is the same setting used for the Logger. I used the captureLambdaHandler middleware. This has a number of benefits, including:
- Creating a
ColdStartannotation - Creating a
Serviceannotation - Capture responses or exceptions generated by the handler and include them as tracing metadata
I also used the captureAWS methdod to patch all AWS SDK v2 clients which the demo uses.
const { Tracer, captureLambdaHandler } = require('@aws-lambda-powertools/tracer');
const middy = require('@middy/core');

//  Params fetched from the env vars
const tracer = new Tracer();
tracer.captureAWS(require('aws-sdk'));

const handler = async (event) => {
    ...
};

module.exports.handler = middy(handler)
  .use(injectLambdaContext(logger))
  .use(captureLambdaHandler(tracer));
In the AWS X-Ray service, you can look at the raw data. This shows the custom annotations created by the Tracer library.
    ...
    "subsegments": [
        {
            ...
            "annotations": {
                "ColdStart": false,
                "Service": "createLicence"
            },
This also means you can use a filter expression to filter the traces that are shown:
annotation.Service = "createLicence" AND annotation.ColdStart = true
Clicking on one of the traces, you can see the trace map, which in this case traces from API Gateway to Lambda to QLDB. As we had filtered by cold start, the trace details also show the initialisation time for the Lambda function.

In the trace above, an HTTP 400 error is returned, as it was a duplicate request. This was returned using a custom response as opposed to throwing an error from the function, which would have been highlighted in red in the trace.
As the responses are returned as metadata, we can click into the metadata section of the function to see the actual response

This can be disabled if it might contain sensitive data.
Metrics
Finally, it was time to capture some metrics, starting again by installing the library:
npm install @aws-lambda-powertools/metrics
The Metrics library requires a Metrics Namespace and Service Name which were set as environment variables again.
The logMetrics middleware is useful as it will automatically flush any metrics created. It also supports a captureColdStartMetric param which is set to true. This allows you to keep cold start metrics separate from application metrics if needed.
To test it out, I added two simple metrics, which counted the number of successful and failed attempts to create a new licence:
const { Metrics, MetricUnits, logMetrics } = require('@aws-lambda-powertools/metrics');
const middy = require('@middy/core');

//  Params fetched from the env vars
const metrics = new Metrics();

const handler = async (event) => {
    try {
        metrics.addMetric('createLicenceSucceeded', MetricUnits.Count, 1);
    } catch (error) {
        metrics.addMetric('createLicenceFailed', MetricUnits.Count, 1);
    }
};

module.exports.handler = middy(handler)
  .use(injectLambdaContext(logger))
  .use(captureLambdaHandler(tracer))
  .use(logMetrics(metrics, { captureColdStartMetric: true }));
All that was left was to send in a few requests, including several duplicate requests that would fail, and it was then simple to start graphing some of these metrics:

Conclusion
AWS Lambda Powertools for Typescript is an awesome new library for anyone that develops Lambda functions in JavaScript. With the experience and support of the developer experience team at AWS, you should definitely check it out, and I can see it being my go to library for bootstrapping all new serverless projects written in JavaScript. Hats off to the team that made the release possible, which includes Sara Gerion, Heitor Lessa, Florian Chazal, @ijemmy, Andrea Amorosi, Alan Churley, and Michael Bahr.
To try this out yourself, check out the backend folder in qldb simple demo on GitHub.


Top comments (0)