Open standards, specifically the ones implemented by OpenTelemetry, are becoming the de-facto mechanism of implementing observability for numerous organizations that support this CNCF initiative. This blog post showcases how an organization can easily build a central observability platform with single-pane-of-glass visibility into their various applications that run both in the public cloud as well as in private data centers.
Our solution provisions a fully managed platform with AWS Distro for OpenTelemetry (ADOT) at its foundation, and leverages Amazon Managed Grafana, Amazon Managed Service for Prometheus, and Amazon OpenSearch Service for storage and analysis of the three core dimensions of observability – metrics, logs, and traces. These core dimensions can be correlated for faster issue resolution or retrospective analytics, and the solution can be further enhanced for building self-healing capabilities in the application stacks.
It’s worth considering the difference between observability and monitoring. Monitoring lets you know whether a system is working. Observability lets you understand why it isn’t working. Effective observability lets you ask the questions that you didn’t know you wanted to ask. This post aims to provide a solution to achieve good observability.
The following diagram illustrates various managed AWS services utilized for building an observability solution as part of this post.

Figure 1: AWS managed services for building an observability solution.
If open standards are not a must have for your organization then there are additional AWS native services to choose from that can be used to build an observability solution. AWS X-Ray can be used to collect traces and helps developers analyze and debug distributed applications, such as those built using a microservices architecture. Amazon CloudWatch collects monitoring and operational data in the form of logs, metrics, and events. It also provides you with a unified view of AWS resources, applications, and services that run on AWS and on-premises servers. Both services offer agents for easy instrumentation.
Solution Architecture
The following diagram illustrates the solution architecture for designing an observability platform using the managed AWS services mentioned in the previous section. For the purpose of this post, we have considered two AWS accounts with the following responsibilities:
- An AWS observability account with all of the necessary services and infrastructure required for the aggregation and visualization of telemetry data, i.e., metrics, logs, and traces.
- An AWS workload account that will host the application components generating telemetry data. For the purpose of this post, we use Amazon Elastic Kubernetes Service (EKS) for hosting our sample application. AWS Distro for OpenTelemetry (ADOT) Collector will be deployed as a side-car container within application pods as explained later in the subsequent section.

Figure 2: Solution architecture for designing an observability platform using managed AWS services.
The solution can be extended to work with multiple workloads spread across various AWS accounts, including hybrid scenarios where applications could be hosted in on-premises environments. This construct can also be used to interact with 3rd-party owned AWS accounts/workloads.
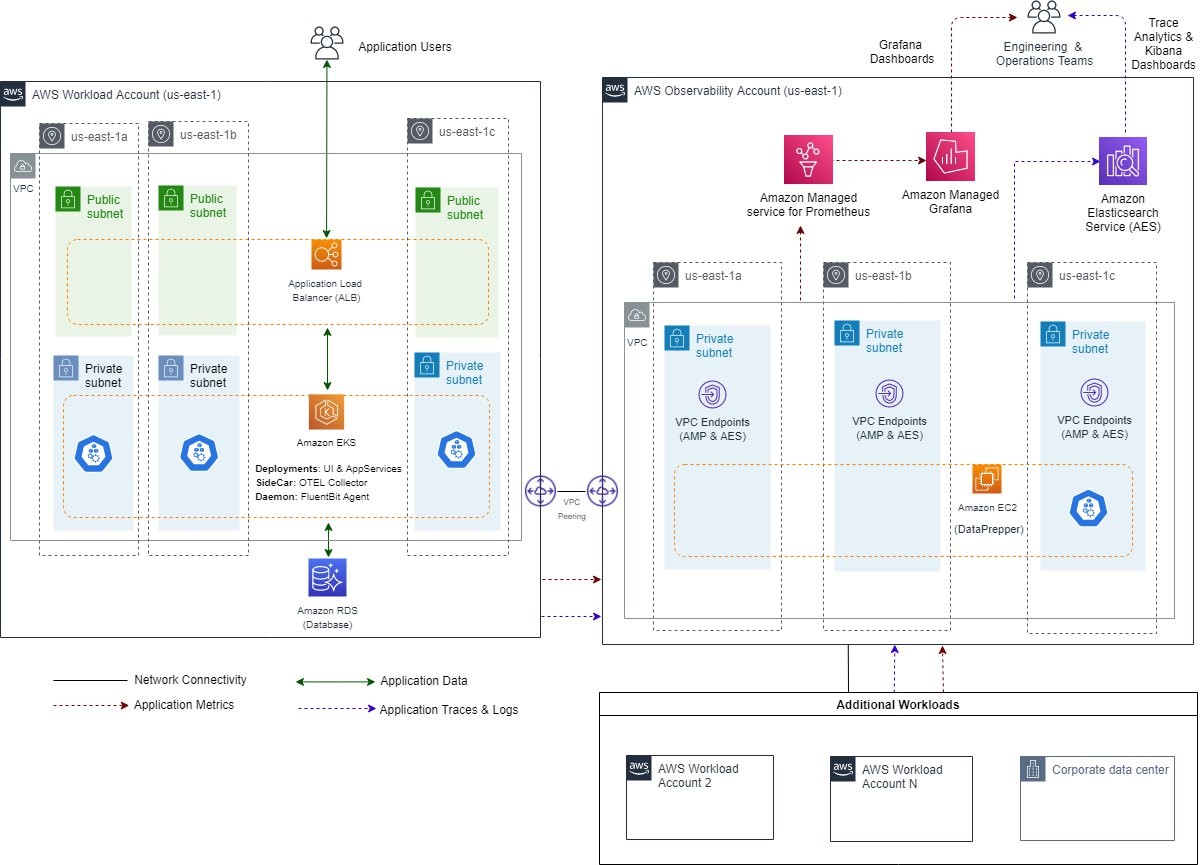
Figure 3: Solution architecture for designing an observability platform using the managed AWS services for hybrid and 3rd-party owned scenarios.
Under the hood – AWS Distro for OpenTelemetry
Let’s dive deep to understand how ADOT enables stitching together of various components illustrated in the solution above.
ADOT is a secure, production ready, and AWS supported distribution of the OpenTelemetry project. The key components offered as part of ADOT that have been leveraged in this solution are:
- AWS Distro for OpenTelemetry Collector, which facilitates the collection and forwarding of metrics and traces.
- AWS OpenTelemetry Instrumentation for Java, which dynamically injects bytecode to capture telemetry from a number of popular libraries and frameworks.
The following diagram illustrates the flow of metrics and traces from Application services to the Observability Platform.

Figure 4: Flow of metrics and traces from Application services to the Observability Platform.
Each application component is deployed on an Amazon EKS cluster. If we zoom in on an application pod, as illustrated in the diagram below, it has two containers – the primary application container and a side-car container with an ADOT Collector instance. This side-car container supports both the push and pull model for collecting telemetry data from the application container. For example, application services may expose Prometheus endpoints, and the side-car container can periodically scrape metrics from the exposed endpoint. This represents the pull model, and the data retrieved is forwarded to the metrics aggregation solution. In case of traces, the side-car container exposes the endpoint for receiving traces. Then, the application may invoke this endpoint to push traces into the aggregation layer via the side-car container. This represents the push model of using the side-car container.
For the purpose of collecting and forwarding logs, we have leveraged Fluent Bit as the mechanism for collecting logs and that is not yet available within the ADOT collector at the time of writing of this post. The ADOT collector is based on the upstream OpenTelemetry collector project that has a stable implementation for collecting metrics and traces based on the OpenTelemetry specification at the time of writing this post. The latest version of this specification has a stable definition for the data model and protocol for collecting metrics and traces.
Support for the log data model and protocol is in the draft stage at the moment. Once it is defined and implemented in the upstream OpenTelemetry collector project, it will also be made available as part of the ADOT collector. From that point onward, this collector could be used as a unified mechanism for the collection, processing, and forwarding of all of the telemetry data, i.e., metrics, logs, and traces.

Figure 5: Flow of logs from Application services to the Observability Platform leveraging Fluent Bit.
Environment Setup
Prerequisites
- You must have two AWS Accounts available that are part of an AWS organization. One of the accounts will be used as the centralized observability platform account, while the other one will be used for hosting the application workload.
- Make sure that the AWS CLI is installed, and create two profiles – one called ObsAccount and one called AppAccount. The two profiles should be configured with credentials from the two AWS accounts respectively. Instructions on configuring AWS CLI to use profiles are available in the AWS CLI documentation.
- Make sure that you have Amazon EC2 key pairs available to be used while provisioning EC2 instances that are required as part of the environment setup.
- Make sure that the following tools are installed and configured to execute the environment setup instructions:
- AWS CLI
- eksctl
- kubectl
- helm
- docker
- git
- maven
- java
Setup Instructions
Step 1: Clone the git repository for the observability platform from Github and navigate to the observability-platform directory.
git clone https://github.com/aws-samples/aws-blog-observability-platform.git

cd aws-blog-observability-platform
Step 2: Provision AWS infrastructure in the centralized observability account.
2a. Provision Amazon Virtual Private Cloud (VPC) and related resources (subnets, security-groups, route-tables, etc.).
aws cloudformation create-stack \
--stack-name obs-plat-vpc \
--template-body file://deployment/infrastructure/aws-account-observability-platform/cfn-templates/vpc.yml \
--parameters ParameterKey=VpcCIDR,ParameterValue=192.168.0.0/16 ParameterKey=PrivateSubnet1CIDR,ParameterValue=192.168.20.0/24 ParameterKey=PrivateSubnet2CIDR,ParameterValue=192.168.21.0/24 ParameterKey=PublicSubnet1CIDR,ParameterValue=192.168.10.0/24 ParameterKey=PublicSubnet2CIDR,ParameterValue=192.168.11.0/24 \
--profile ObsAccount
2b. Provision Amazon OpenSearch cluster.
#Setup parameters for creating Amazon OpenSearch cluster
admin_username=<<specify admin username>>
admin_password=<<specify admin password>>
vpc_id=$(aws cloudformation describe-stacks --stack-name obs-plat-vpc --query "Stacks[0].Outputs[?OutputKey=='VPC'].OutputValue" --profile ObsAccount --output text)
subnet_id=$(aws cloudformation describe-stacks --stack-name obs-plat-vpc --query "Stacks[0].Outputs[?OutputKey=='PrivateSubnet1'].OutputValue" --profile ObsAccount --output text)

aws cloudformation create-stack \
--stack-name obs-plat-opensearch \
--template-body file://deployment/infrastructure/aws-account-observability-platform/cfn-templates/opensearch.yml \
--parameters ParameterKey=DomainName,ParameterValue=obs-plat-es-cluster ParameterKey=EngineVersion,ParameterValue=OpenSearch_1.0 ParameterKey=InstanceType,ParameterValue=t3.medium.search ParameterKey=VpcId,ParameterValue=${vpc_id} ParameterKey=SubnetId,ParameterValue=${subnet_id} ParameterKey=MasterUserName,ParameterValue=${admin_username} ParameterKey=MasterUserPassword,ParameterValue=${admin_password} \
--profile ObsAccount
It can take 15 – 20 minutes to provision the Amazon OpenSearch cluster.
2c. Provision a ‘DataPrepper’ EC2 instance that will ingest traces from application logs and traces into the OpenSearch cluster.
#Setup parameters for provisioning and configuring DataPrepper EC2 instancedataprepper_ec2_keypair_name=<<specify EC2 key-pair name>>
search_region=<<specify region where Amazon OpenSearch cluster was provisioned e.g. us-east-1>>
search_username=<<specify admin username for OpenSearch cluster provisioned in previous step>>
search_password=<<specify admin password for OpenSearch cluster provisioned in previous step>>
search_endpoint=<<specify OpenSearch cluster VPC endpoint>>
search_vpc_id=$(aws cloudformation describe-stacks --stack-name obs-plat-vpc --query "Stacks[0].Outputs[?OutputKey=='VPC'].OutputValue" --profile ObsAccount --output text)
search_subnet_id=$(aws cloudformation describe-stacks --stack-name obs-plat-vpc --query "Stacks[0].Outputs[?OutputKey=='PrivateSubnet1'].OutputValue" --profile ObsAccount --output text)
dataprepper_ec2_keypair_name=<<specify EC2 key-pair name>>

aws cloudformation create-stack \
--stack-name obs-plat-dataprepper \
--template-body file://deployment/infrastructure/aws-account-observability-platform/cfn-templates/dataprepper.yml \
--parameters ParameterKey=OpenSearchEndpoint,ParameterValue=${search_endpoint} ParameterKey=OpenSearchRegion,ParameterValue=${search_region} ParameterKey=OpenSearchVpcId,ParameterValue=${search_vpc_id} ParameterKey=OpenSearchSubnetId,ParameterValue=${search_subnet_id} ParameterKey=OpenSearchUsername,ParameterValue=${search_username} ParameterKey=OpenSearchPassword,ParameterValue=${search_password} ParameterKey=KeyName,ParameterValue=${dataprepper_ec2_keypair_name} \
--profile ObsAccount
2d. Provision a bastion host EC2 instance in the observability account for any future troubleshooting, as well as for accessing OpenSearch dashboards.
#Setup parameters for provisioning and configuring bastion host
bastionhost_ec2_keypair_name=<<specify EC2 key-pair name>>
vpc_id=$(aws cloudformation describe-stacks --stack-name obs-plat-vpc --query "Stacks[0].Outputs[?OutputKey=='VPC'].OutputValue" --profile ObsAccount --output text)
public_subnet_id=$(aws cloudformation describe-stacks --stack-name obs-plat-vpc --query "Stacks[0].Outputs[?OutputKey=='PublicSubnet1'].OutputValue" --profile ObsAccount --output text)

aws cloudformation create-stack \
--stack-name obs-plat-bastionhost \
--template-body file://deployment/infrastructure/aws-account-observability-platform/cfn-templates/bastionhost.yml \
--parameters ParameterKey=VpcId,ParameterValue=${vpc_id} ParameterKey=SubnetId,ParameterValue=${public_subnet_id} ParameterKey=KeyName,ParameterValue=${bastionhost_ec2_keypair_name} \
--profile ObsAccount
2e. Provision Amazon Managed Service for Prometheus.
aws amp create-workspace --alias obs-plat-prometheus --profile ObsAccount
2f. Provision Amazon Managed Grafana workspace by following the instructions mentioned in the following post: Amazon Managed Grafana – Getting Started.
2g. Navigate to the AWS Console for each of the deployed AWS services and validate that all of the resources provisioned in the previous step are active and in a healthy state.
2h. Get the AWS AccountID of the observability account to be used in the setup steps of the Application Workload Account.
#Get Observability account AWS Account ID
aws sts get-caller-identity --profile ObsAccount --query 'Account'
Step 3: Provision AWS infrastructure in the Application Workload AWS account.
3a. Provision Amazon VPC and related resources (subnets, security-groups, route-tables, etc.).
#Setup parameters for provisioning vpc and related resources
observability_platform_aws_account_number=$(aws sts get-caller-identity --profile ObsAccount --query 'Account')

aws cloudformation create-stack \
--stack-name app-workload-vpc \
--template-body file://deployment/infrastructure/aws-account-application-workload/cfn-templates/vpc.yml \
--parameters ParameterKey=VpcCIDR,ParameterValue=10.192.0.0/16 ParameterKey=PrivateSubnet1CIDR,ParameterValue=10.192.20.0/24 ParameterKey=PrivateSubnet2CIDR,ParameterValue=10.192.21.0/24 ParameterKey=PublicSubnet1CIDR,ParameterValue=10.192.10.0/24 ParameterKey=PublicSubnet2CIDR,ParameterValue=10.192.11.0/24 ParameterKey=PeerOwnerId,ParameterValue=${observability_platform_aws_account_number} \
--capabilities CAPABILITY_IAM \
--profile AppAccount
3b. Provision the bastion host.
#Setup parameters for provisioning and configuring bastion host
bastionhost_ec2_keypair_name=<<specify EC2 key-pair name>>
vpc_id=$(aws cloudformation describe-stacks --stack-name app-workload-vpc --query "Stacks[0].Outputs[?OutputKey=='VPC'].OutputValue" --profile AppAccount --output text)
public_subnet_id=$(aws cloudformation describe-stacks --stack-name app-workload-vpc --query "Stacks[0].Outputs[?OutputKey=='PublicSubnet1'].OutputValue" --profile AppAccount --output text)

aws cloudformation create-stack \
--stack-name app-workload-bastionhost \
--template-body file://deployment/infrastructure/aws-account-observability-platform/cfn-templates/bastionhost.yml \
--parameters ParameterKey=VpcId,ParameterValue=${vpc_id} ParameterKey=SubnetId,ParameterValue=${public_subnet_id} ParameterKey=KeyName,ParameterValue=${bastionhost_ec2_keypair_name} \
--profile AppAccount
3c. Provision Amazon RDS for MySQL resource.
#Setup parameters for creating Amazon RDS cluster
admin_username=<<specify admin username>>
admin_password=<<specify admin password>>
vpc_id=$(aws cloudformation describe-stacks --stack-name app-workload-vpc --query "Stacks[0].Outputs[?OutputKey=='VPC'].OutputValue" --profile AppAccount --output text)
private_subnet1_id=$(aws cloudformation describe-stacks --stack-name app-workload-vpc --query "Stacks[0].Outputs[?OutputKey=='PrivateSubnet1'].OutputValue" --profile AppAccount --output text)
private_subnet2_id=$(aws cloudformation describe-stacks --stack-name app-workload-vpc --query "Stacks[0].Outputs[?OutputKey=='PrivateSubnet2'].OutputValue" --profile AppAccount --output text)

aws cloudformation create-stack \
--stack-name app-workload-rds \
--template-body file://deployment/infrastructure/aws-account-application-workload/cfn-templates/rds.yml \
--parameters ParameterKey=VpcId,ParameterValue=${vpc_id} ParameterKey=PrivateSubnet1Id,ParameterValue=${private_subnet1_id} ParameterKey=PrivateSubnet2Id,ParameterValue=${private_subnet2_id} ParameterKey=AdminUsername,ParameterValue=${admin_username} ParameterKey=AdminUserPassword,ParameterValue=${admin_password} \
--profile AppAccount
3d. Setup Amazon EKS cluster for hosting the application workload.
#Setup parameters for creating Amazon EKS cluster
private_subnet1_id=$(aws cloudformation describe-stacks --stack-name app-workload-vpc --query "Stacks[0].Outputs[?OutputKey=='PrivateSubnet1'].OutputValue" --profile AppAccount --output text)
private_subnet2_id=$(aws cloudformation describe-stacks --stack-name app-workload-vpc --query "Stacks[0].Outputs[?OutputKey=='PrivateSubnet2'].OutputValue" --profile AppAccount --output text)
eks_region=<<specify region where Amazon EKS cluster was provisioned e.g. us-east-1>>

eksctl create cluster \
--name app-workload-eks --with-oidc \
--nodegroup-name ng-1-workers --nodes 2 --managed --node-private-networking \
--vpc-private-subnets ${private_subnet1_id},${private_subnet2_id} \
--region ${eks_region} \
--profile AppAccount
3e. Setup AWS Load Balancer Controller by following the instructions mentioned in the documentation located at User Guide – AWS Load Balancer Controller.
3f. Create ECR Public Repository.
aws cloudformation create-stack \
--stack-name app-workload-ecr \
--template-body file://deployment/infrastructure/aws-account-application-workload/cfn-templates/ecr.yml \
--profile AppAccount --region us-east-1
Note that the ECR-public repositories are only available in the us-east-1 region at the time of writing this post. Therefore, we are overriding the region from the AWS profile with us-east-1 explicitly in the command above.
3g. Navigate to the AWS Console for each of the provisioned resources and validate that all of the resources provisioned in the previous step are active and in a healthy state.
Step 4. Setup connectivity via VPC Peering between the centralized observability VPC and the application workload VPC.
4a. Request VPC peering from the observability platform AWS Account to the application workload AWS Account.
#Setup parameters for configuring vpc peering
application_workload_aws_account_number=$(aws sts get-caller-identity --profile AppAccount --query 'Account')
application_workload_vpc_id=$(aws cloudformation describe-stacks --stack-name app-workload-vpc --query "Stacks[0].Outputs[?OutputKey=='VPC'].OutputValue" --profile AppAccount --output text)
application_workload_vpc_peer_role_arn=$(aws cloudformation describe-stacks --stack-name app-workload-vpc --query "Stacks[0].Outputs[?OutputKey=='PeerRoleARN'].OutputValue" --profile AppAccount --output text)
observability_platform_vpc_id=$(aws cloudformation describe-stacks --stack-name obs-plat-vpc --query "Stacks[0].Outputs[?OutputKey=='VPC'].OutputValue" --profile ObsAccount --output text)

aws cloudformation create-stack \
--stack-name obs-plat-vpc-peering \
--template-body file://deployment/cross-account-connection/aws-account-observability-platform/vpc-peering-request.yml \
--parameters ParameterKey=PeerName,ParameterValue=obs-plat-app-workload-peering ParameterKey=PeerOwnerId,ParameterValue=${application_workload_aws_account_number} ParameterKey=PeerRoleARN,ParameterValue=${application_workload_vpc_peer_role_arn} ParameterKey=PeerVpcId,ParameterValue=${application_workload_vpc_id} ParameterKey=VpcId,ParameterValue=${observability_platform_vpc_id} \
--profile ObsAccount
4b. Update the routing table for the observability platform AWS Account VPC.
#Setup parameters for updating route table
application_workload_vpc_cidr=10.192.0.0/16
observability_platform_route_table1_id=$(aws cloudformation describe-stacks --stack-name obs-plat-vpc --query "Stacks[0].Outputs[?OutputKey=='PrivateRouteTable1'].OutputValue" --profile ObsAccount --output text)
observability_platform_route_table2_id=$(aws cloudformation describe-stacks --stack-name obs-plat-vpc --query "Stacks[0].Outputs[?OutputKey=='PrivateRouteTable2'].OutputValue" --profile ObsAccount --output text)
observability_platform_vpc_peering_connection_id=$(aws cloudformation describe-stacks --stack-name obs-plat-vpc-peering --query "Stacks[0].Outputs[?OutputKey=='VPCPeeringConnectionId'].OutputValue" --profile ObsAccount --output text)

aws cloudformation create-stack \
--stack-name obs-plat-vpc-peering-routes \
--template-body file://deployment/cross-account-connection/aws-account-observability-platform/vpc-peering-routes.yml \
--parameters ParameterKey=PeerVpcCIDR,ParameterValue=${application_workload_vpc_cidr} ParameterKey=RouteTableIds,ParameterValue=\"${observability_platform_route_table1_id},${observability_platform_route_table2_id}\" ParameterKey=VpcPeeringConnectionId,ParameterValue=${observability_platform_vpc_peering_connection_id} \
--profile ObsAccount
4c. Update the routing table for application workload AWS Account VPC.
#Setup parameters for updating route table
observability_platform_vpc_cidr=192.168.0.0/16
application_workload_route_table1_id=$(aws cloudformation describe-stacks --stack-name app-workload-vpc --query "Stacks[0].Outputs[?OutputKey=='PrivateRouteTable1'].OutputValue" --profile AppAccount --output text)
application_workload_route_table2_id=$(aws cloudformation describe-stacks --stack-name app-workload-vpc --query "Stacks[0].Outputs[?OutputKey=='PrivateRouteTable2'].OutputValue" --profile AppAccount --output text)
application_workload_vpc_peering_connection_id=$(aws cloudformation describe-stacks --stack-name obs-plat-vpc-peering --query "Stacks[0].Outputs[?OutputKey=='VPCPeeringConnectionId'].OutputValue" --profile ObsAccount --output text)

aws cloudformation create-stack \
--stack-name app-workload-vpc-peering-routes \
--template-body file://deployment/cross-account-connection/aws-account-application-workload/vpc-peering-routes.yml \
--parameters ParameterKey=PeerVpcCIDR,ParameterValue=${observability_platform_vpc_cidr} ParameterKey=RouteTableIds,ParameterValue=\"${application_workload_route_table1_id},${application_workload_route_table2_id}\" ParameterKey=VpcPeeringConnectionId,ParameterValue=${application_workload_vpc_peering_connection_id} \
--profile AppAccount
4d. Create a VPC Endpoint for Amazon Managed Service for Prometheus in the Observability Platform AWS Account.
vpc_id=$(aws cloudformation describe-stacks --stack-name obs-plat-vpc --query "Stacks[0].Outputs[?OutputKey=='VPC'].OutputValue" --profile ObsAccount --output text)
subnet_id1=$(aws cloudformation describe-stacks --stack-name obs-plat-vpc --query "Stacks[0].Outputs[?OutputKey=='PrivateSubnet1'].OutputValue" --profile ObsAccount --output text)
subnet_id2=$(aws cloudformation describe-stacks --stack-name obs-plat-vpc --query "Stacks[0].Outputs[?OutputKey=='PrivateSubnet2'].OutputValue" --profile ObsAccount --output text)
REGION=<<specify region where Amazon EKS cluster was provisioned e.g. us-east-1>>

VPC_ENDPOINT_ID=$(aws ec2 create-vpc-endpoint \
  --vpc-id $vpc_id \
  --vpc-endpoint-type Interface \
  --service-name com.amazonaws.${REGION}.aps-workspaces \
  --subnet-ids $subnet_id1 $subnet_id2 \
  --no-private-dns-enabled \
  --query 'VpcEndpoint.VpcEndpointId' \
  --profile ObsAccount \
  --output text)
4e. Create an Amazon Route 53 private hosted zone for Amazon Managed Service for Prometheus DNS Name in the Observability Platform AWS Account.
# Define Environment Variables
export vpc_id=$(aws cloudformation describe-stacks --stack-name obs-plat-vpc --query "Stacks[0].Outputs[?OutputKey=='VPC'].OutputValue" --profile ObsAccount --output text)
export subnet_id1=$(aws cloudformation describe-stacks --stack-name obs-plat-vpc --query "Stacks[0].Outputs[?OutputKey=='PrivateSubnet1'].OutputValue" --profile ObsAccount --output text)
export subnet_id2=$(aws cloudformation describe-stacks --stack-name obs-plat-vpc --query "Stacks[0].Outputs[?OutputKey=='PrivateSubnet2'].OutputValue" --profile ObsAccount --output text)
export DEFAULT_SG=$(aws ec2 describe-security-groups --filters Name=vpc-id,Values=$vpc_id Name=group-name,Values='default' --query 'SecurityGroups[].GroupId' --profile ObsAccount --output text)
export REGION=<<specify region where Amazon EKS cluster was provisioned e.g. us-east-1>>
export app_workload_vpc_id=$(aws cloudformation describe-stacks --stack-name app-workload-vpc --query "Stacks[0].Outputs[?OutputKey=='VPC'].OutputValue" --profile AppAccount --output text)
export application_account_cidr=$(aws ec2 describe-vpcs --vpc-ids $app_workload_vpc_id --profile AppAccount --output text | awk '/VPCS/{print $2}')

# Execute the following Script to perform the following actions
## 1. Create VPC Endpoint on Amazon Managed Prometheus Service on Observability account
## 2. Create Route53 Private Hosted Zone on Observability account to host DNS record for VPC Endpoint
## 3. Creates DNS Record for VPC Endpoint on the Pvt Hosted zone create in step 2 above
## 4. Authorizes Application Workload Account to issue a request to associate the VPC with a specified hosted zone
## 5. Associate Application Workload Account VPC  to Observability Account Private Hosted Zone
## 6. Update Default Security Group associated with VPCEndpoint to allow traffic from Application workload Account

sh deployment/cross-account-connection/aws-account-observability-platform/create_vpcendpoint_route53pvtzone_and_associate.sh

# As a result of executing the above script, the traffic from Application Workload account
# to the Amazon Managed Prometheus Account in Observability account over private VPC peering connection
# and does not traverse the internet
Step 5. Configure dashboards in the Amazon Managed Grafana workspace in the observability platform AWS Account.
5a. Setup the Cross-account Identity and Access Management (IAM) role to grant permissions to the Prometheus remote write endpoint.
#Setup parameters for configuring vpc peering
application_workload_aws_account_number=$(aws sts get-caller-identity --profile AppAccount --query 'Account')

aws cloudformation create-stack \
--stack-name obs-plat-cross-account-role --capabilities CAPABILITY_NAMED_IAM \
--template-body file://deployment/application/aws-account-observability-platform/cfn-templates/cross-account-role.yml \
--parameters ParameterKey=RoleName,ParameterValue=CustomPrometheusRemoteWriteRole ParameterKey=CrossAccountId,ParameterValue=${application_workload_aws_account_number} \
--profile ObsAccount
5b. Update the Amazon EKS worker node instance profile role with the following inline policy to assume the cross-account role.
{
    "Version": "2012-10-17",
    "Statement": [
     {
        "Effect": "Allow",
        "Action": "sts:AssumeRole",
        "Resource": "arn:aws:iam::<<observability-platform-aws-account-number>>:role/CustomPrometheusRemoteWriteRole"
     }
    ]
}
5c. Import Grafana dashboards that are available in the folder located at deployment/application/aws-account-observability-platform/dashboards.
Before importing dashboards using the Grafana console:
- Make sure that the Prometheus instance is available as a data source within Grafana.
- Replace ‘<<prometheus-workspace-id>> and ‘<<aws-region>>’ placeholders in the dashboard json files with values from the previously provisioned environment. One way to bulk update files is by using sed as follows:
sed -i 's/<<prometheus-workspace-id>>/<<substitute-prometheus-workspace-id>>/g' ./deployment/application/aws-account-observability-platform/dashboards/*
sed -i 's/<<aws-region>>/<<substitute-prometheus-workspace-aws-region>>/g' ./deployment/application/aws-account-observability-platform/dashboards/*
Step 6. Deploy the demo application in the application workload AWS account.
6a. Execute database setup scripts on the RDS instance via bastion host. The scripts are available in the following location: deployment/application/aws-account-application-workload/db-scripts. Make sure that the mysql client is available on bastion host before executing the following commands:
mysql -h <<rds-endpoint>> -u <<username>> -p < customers-db.sql
mysql -h <<rds-endpoint>> -u <<username>> -p < visits-db.sql
mysql -h <<rds-endpoint>> -u <<username>> -p < vets-db.sql
6b. Execute script to build application and push docker images.
#Setup parameters for building and publishing docker images
repository_prefix=<<Specify ECR Public Repository Prefix e.g. public.ecr.aws/v7c7y5u4>>

aws ecr-public get-login-password --profile AppAccount --region us-east-1 | docker login --us
ername AWS --password-stdin ${repository_prefix}

deployment/application/aws-account-application-workload/docker/build.sh ${repository_prefix}
6c. Deploy the application using the helm package manager.
helm install \
--set AWSRegion='<<specify AWS Region where application will be deployed e.g. us-east-1>>' \
--set DataPrepperHostIP='<<specify IP address of the EC2 instance on which DataPrepper installation was done in Step 2c.>>' \
--set DataPrepperHostPort=' <<specify port number on which DataPrepper is listening to. Use 21890 unless another port has been configured. >>' \
--set AWSPrometheusRemoteWriteEndpointURL='<<specify remote write endpoint of Amazon Managed service for prometheus instance provisioned in Step 2e>>' \
--set AWSMonitoringAccountRoleARN='<<specify cross-account IAM Role ARN with permissions to remote prometheus endpoint provisioned in Step 5a>>' \
--set ImageRepositoryPrefix='<<specify ECR public repository image prefix e.g. public.ecr.aws/v7c7y5u4>>' \
--set RDSDataSourceURL='<<specify RDS datasource url e.g. jdbc:mysql://od1nbxen8td5wd4.ca1g6fnlnd1x.us-east-1.rds.amazonaws.com >>' \
--set RDSDataSourceUsername='<<specify RDS admin username>>' \
--set RDSDataSourcePassword='<<specify RDS admin password>>' \
--set AWSOpenSearchHostName='<<specify Amazon OpenSearch instance Host Name>>' \
--set AWSOpenSearchAuthUsername='<<specify Amazon OpenSearch instance Username>>' \
--set AWSOpenSearchAuthPassword='<<specify Amazon OpenSearch instance Password>>' \
petclinic-app deployment/application/aws-account-application-workload/k8s/helm
6d. Navigate to the homepage of the PetClinic Application, and validate that it is available. The homepage URL is in the format
http://<<application-load-balancer-host-name>>/petclinic-ui/#!/welcome

Figure 6: Homepage of the PetClinic Application.
Observability Platform – Dashboards
The following section demonstrates various dashboards and capabilities offered by the Observability Platform related to centralized monitoring, logging, and tracing.
Centralized Monitoring with Amazon Managed Service for Prometheus and Amazon Managed Grafana
One of the benefits of aggregating metrics into a centralized instance of Amazon Managed Service for Prometheus is that these metrics can be displayed via Grafana dashboards, thereby providing a comprehensive view of the health of various components of the distributed system.
For example, the following screenshot displays the centralized macro-level health dashboard with all of the component micro-services in the PetClinic Application.

Figure 7: Centralized macro-level health dashboard with all of the component micro-services in the PetClinic Application.
Then, this single-pane-of-glass dashboard can have navigation links to the detailed dashboard where additional metrics related to a specific micro-service can be accessed. For example, the following screenshot displays the detailed dashboard for customer micro-service.

Figure 8: Single-pane-of-glass dashboard with navigation links to the detailed dashboard.
Amazon Managed Grafana also provides the ability to create alerts for the metrics displayed above, and it is integrated with several notification channels (e.g., Amazon SNS, Slack). Additional details related to setting up alerts can be found in the service documentation.
Centralized Tracing with Amazon OpenSearch and Trace Analytics Plug-in
All of the traces that are auto-generated by the PetClinic application using AWS Distro for OpenTelemetry Java Instrumentation library are captured into an index within the Amazon OpenSearch service. This service also provides the Trace Analytics plugin, which can be used to visualize aggregate data for traces, as well as detailed information related to an individual trace.
For example, the following screenshot shows the Dashboard view within the Trace Analytics plug-in, which provides an aggregate view of traces for endpoints of micro-services within the PetClinic application.

Figure 9: Dashboard for an aggregated view of traces for endpoints of micro-services within the PetClinic application.
Another view offered by the Trace Analytics plugin focuses on providing a list of traces available for each endpoint in the micro-service. It is possible to filter this based on various attributes, as well as to narrow down the search to a specific time-frame.

Figure 10: Dashboard view to provide a list of traces available for each endpoint in the micro-service.
If we select a specific trace from the list of traces, then we would navigate to the detailed view of a specific trace. The following view displays various micro-services involved in the API request, and the time spent in each micro-service.

Figure 11: Detailed view of a specific trace.
Centralized Logging with Amazon OpenSearch Service and Dashboards
All of the logs for various micro-services are also aggregated within the Amazon OpenSearch service. Moreover, each log has the trace-ID within the log statement. This allows for the correlation of trace identified using the Trace Analytics plugin and the retrieving of various logs associated with that service request.
The following screenshot displays the OpenSearch Dashboard Discover UI for filtering logs for specific trace-IDs, which enables the visualization of logs spanning various micro-services and correlated using trace-ID.

Figure 12: OpenSearch Dashboard Discover UI for filtering logs for specific trace-IDs.
Cleanup
This section provides the necessary information for deleting various resources created as part of this post in both AWS Observability and Workload accounts
AWS Observability Account
- Delete VPC Endpoint , Route53 Private Hosted Record, and Zone
- #This deletes following
## 1. DNS entry for VPC endpoint from route53 private hosted zone
## 2. Route53 Private Hosted zone
## 3. VPC Endpoint for Amazon Managed Prometheus Servicesh deployment/cross-account-connection/aws-account-observability-platform/delete_vpcendpoint_route53pvtzone_and_associate.sh
- Delete CloudFormation Stacks with the prefix obs-plt created as part of this post.
-
aws cloudformation delete-stack --stack-name obs-plat-vpc-peering-routes
aws cloudformation delete-stack --stack-name obs-plat-vpc-peering
aws cloudformation delete-stack --stack-name obs-plat-cross-account-role
aws cloudformation delete-stack --stack-name obs-plat-bastionhost
aws cloudformation delete-stack --stack-name obs-plat-dataprepper
aws cloudformation delete-stack --stack-name obs-plat-opensearch
aws cloudformation delete-stack --stack-name obs-plat-vpc
- Delete the Amazon Managed Service Grafana instance
- Navigate to AWS Console > Amazon Grafana > Select workspace created during provisioning > Delete
- Delete the Amazon Managed Service for Prometheus instance
-
obsAmpWorkspaceId=$(aws amp list-workspaces --query 'workspaces[?alias==`obs-plat-prometheus`].workspaceId | [0]' --output text --profile ObsAccount)
aws amp delete-workspace --workspace-id=${obsAmpWorkspaceId} --profile ObsAccount
AWS Workload Account
From the terminal, issue the following commands:
- Delete the CloudFormation stacks with the prefix app-workload created as part of this post.
-
aws cloudformation delete-stack --stack-name app-workload-vpc-peering-routes
aws cloudformation delete-stack --stack-name app-workload-vpc
aws cloudformation delete-stack --stack-name app-workload-bastionhost
aws cloudformation delete-stack --stack-name app-workload-rds
aws cloudformation delete-stack --stack-name app-workload-ecr
- Delete the Amazon EKS cluster created earlier for hosting the application workload
-
eksctl delete cluster --name app-workload-eks
Conclusion
In this post, we have shown you how to build an open standards observability solution using managed AWS services. We centralized the metrics, traces, and logs collected from workloads running in various AWS accounts using ADOT, Amazon Managed Grafana, Amazon Managed Service for Prometheus, and Amazon OpenSearch Service. To visualize these metrics, traces, logs, and to show correlation, we setup an OpenSearch dashboard and a Grafana workspace with Amazon Managed Grafana. This provided us with a native integration with Amazon Managed Service for Prometheus. We also leveraged a hub-and-spoke architecture for solution scalability. To keep networking simple, we leveraged VPC Peering in this post. AWS PrivateLink or AWS Transit Gateway are some other options that can be easily refactored to minimize coupling between the hub and spokes. The solution also demonstrated segregation of duties between owners of workload accounts and those of the centralized observability accounts to empower development and operations velocity while simultaneously minimizing cross-account operations risk.
About the author