AWS Cloud Operations & Migrations Blog
Monitoring Amazon EMR on EKS with Amazon Managed Prometheus and Amazon Managed Grafana
Apache Spark is an open-source lightning-fast cluster computing framework built for distributed data processing. With the combination of Cloud, Spark delivers high performance for both batch and real-time data processing at a petabyte scale. Spark on Kubernetes is supported from Spark 2.3 onwards, and it gained a lot of traction among enterprises for high performance and cost-effective ways of running data workloads. Spark users care about less management overhead and high performance at scale. With Amazon EMR on EKS, developers can focus on running and optimizing their Spark applications rather than setting up and managing their infrastructure. When optimizing the Spark jobs, Observability is critical and an essential piece of infrastructure.
Amazon Managed Service for Prometheus is a serverless monitoring service for metrics that is compatible with open-source Prometheus. Amazon Prometheus makes it easier to securely monitor and alert container environments, and it automatically scales as your monitoring needs grow. Furthermore, it offers highly available, multiple Availability Zone replication and integrates AWS security and compliance capabilities. Amazon Managed Grafana is a fully managed service with rich, interactive data visualizations that help customers analyze, monitor, and alarm on metrics, logs, and traces across multiple data sources.
Amazon EMR on EKS lets customers run Spark applications alongside other application types on the same Amazon EKS cluster to improve resource utilization and simplify infrastructure management. EMR on EKS dynamically configures the infrastructure based on the Spark job’s compute, memory, and application dependencies. A Spark Job can spin up hundreds of worker pods (aka executors) in an EKS Cluster to process the data workloads. Therefore, it is crucial to observe the Spark job execution metrics in-flight and gain insights into the resource usage of Spark driver and executors. Moreover, the essential metrics must be stored centrally to monitor the jobs and raise alerts on performance degradation, memory leaks, etc.
In this post, we will learn to build end-to-end observability for EMR on EKS Spark workloads by leveraging Amazon Managed Service for Prometheus to collect and store the metrics generated by Spark Applications. We will then use Amazon Managed Grafana to build dashboards for monitoring use cases.
Solution Overview
In this solution, we will use EMR on EKS Virtual Cluster to submit Spark Jobs with Prometheus Servlet config. Apache Spark Release 3.0 introduced a new PrometheusServlet sink feature to expose the Spark Driver and Executor metrics in Prometheus format. Spark’s metrics configuration property is defined in Spark configuration, so that drivers and executors emit metrics that can be collected by the Prometheus server. Therefore, you must configure the auto scaling configuration for the Prometheus server to handle the load.
The Prometheus Node Exporter is used to expose various hardware and kernel-related metrics from EKS Cluster nodes. Prometheus server collects these metrics and writes to remote Amazon Managed Service for Prometheus endpoints via remote_write config property. In turn, Amazon Managed Grafana uses Amazon Managed Service for Prometheus workspace as the data source for its dashboards. Amazon Managed Grafana is used for visualizing data via dashboards.
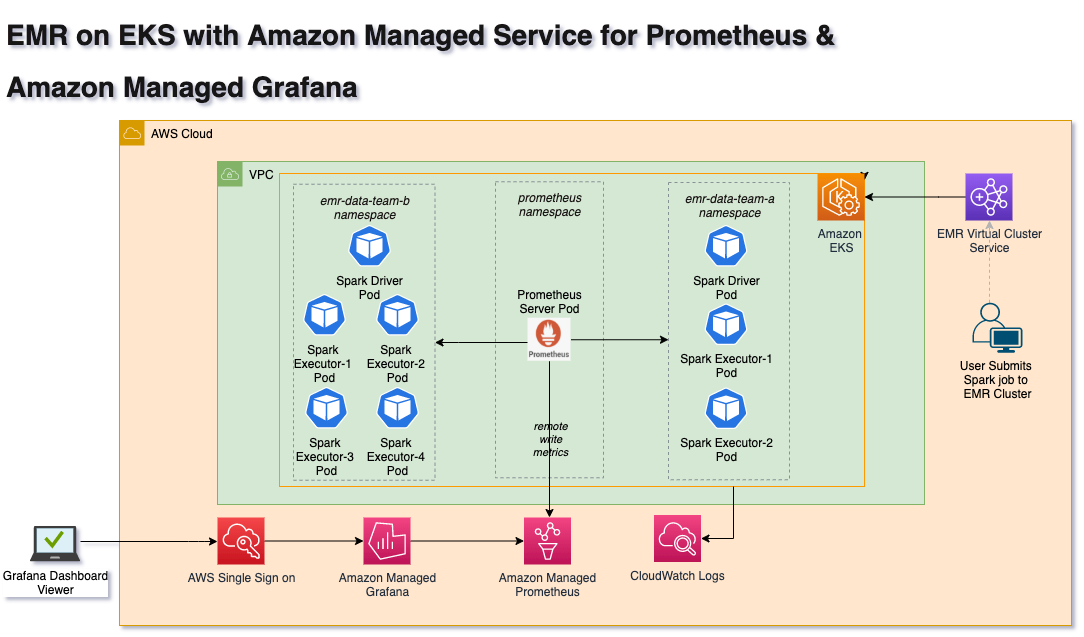
Architecture
The following diagram illustrates the solution architecture for scraping Spark Driver and Executors’ metrics, as well as writing to Amazon Managed Service for Prometheus.
Deploying the Solution
In this post, you will provision the following resources required to run Spark Jobs using Data on EKS Terraform templates, as well as monitor job metrics using Amazon Managed Prometheus and Amazon Managed Grafana. Amazon Managed Grafana setup is a manual process in this blog but this can be automated if you have AWS SSO enabled in your AWS account.
- Virtual Private Cloud(VPC), three private subnets, three public subnets, single NAT Gateway, and Internet gateway
- Amazon EKS Cluster with one Managed Node group
- EMR on EKS Virtual Cluster, Namespace, service accounts and IAM Roles for Service Accounts(IRSA)
- Install Prometheus Server
- Amazon Managed Prometheus with remote write
- Amazon Managed Grafana
Prerequisites
Before you build the entire infrastructure, you must meet the following prerequisites.
- An AWS Account with valid AWS credentials
- AWS Command Line Interface (CLI)
- Terraform 1.0.1
- kubectl – Kubernetes CLI
Deployment
Let’s deploy the solution.
Step 1: Clone the repo
Open your Terminal window, change to home directory, and clone the repo.
cd ~
git clone https://github.com/awslabs/data-on-eks.git
Then, navigate to
cd ~/data-on-eks/analytics/terraform/emr-eks-karpenterStep 2: Initialize Terraform
Initialize the project, which downloads plugins that allow Terraform to interact with AWS Services.
terraform initStep 3: Terraform Plan
Execute the Terraform plan to verify the resources created by this deployment. terraform plan output will show the resources that will be created by this plan
export AWS_REGION="<enter-your-region>"
terraform plan
Step 4: Terraform Apply
Finally, execute terraform apply to deploy the resources. This deployment may take up to 30 minutes to create all of the resources.
terraform apply --auto-approveStep 5: Verify the resources
Let’s verify the resources created by Step 4.
Verify the Amazon EKS Cluster and Amazon Managed service for Prometheus
aws eks describe-cluster --name emr-eks-karpenter

aws amp list-workspaces --alias amp-ws-emr-eks-karpenter
Verify EMR on EKS Namespaces emr-data-team-a and emr-data-team-b and Pod status for Prometheus, Vertical Pod Autoscaler, Metrics Server and Cluster Autoscaler.
aws eks --region <ENTER_YOUR_REGION> update-kubeconfig --name emr-eks-karpenter # Creates k8s config file to authenticate with EKS Cluster

kubectl get nodes # Output shows the EKS Managed Node group nodes

kubectl get ns | grep emr-data-team # Output shows emr-data-team-a and emr-data-team-b namespaces for data teams

kubectl get pods --namespace=prometheus # Output shows Prometheus server and Node exporter pods

kubectl get pods --namespace=vpa  # Output shows Vertical Pod Autoscaler pods

kubectl get pods --namespace=kube-system | grep  metrics-server # Output shows Metric Server pod

kubectl get pods --namespace=kube-system | grep  cluster-autoscaler # Output shows Cluster Autoscaler pod
The following image shows the Amazon Managed Service for Prometheus workspace.

Step 6: Verify the EMR Virtual Cluster
Log in to the AWS Console, open EMR Service, and select the EMR on EKS Virtual Clusters link. You should see the EMR Virtual cluster(emr-eks-karpenter-emr-data-team-a) in Running state as shown in the following image.

Step 7: Execute Spark Job on EMR Virtual Cluster
Prior to Spark 3.0, Spark metrics were exposed through Spark JMX Sink + Prometheus JMX Converter with a combination of Prometheus JMX exporter. Unfortunately, this approach requires an additional setup with an external jar file. However, this process is now simplified by introducing the native support for Prometheus Monitoring with prometheusServlet Class as the latest feature in Apache Spark3.0. In this blog post, we will use Spark3.0 with prometheusServlet configuration to expose metrics to Prometheus. The prometheusServlet adds a servlet within the existing Spark UI to serve metrics data in the Prometheus format.
Spark users must add the following config to sparkSubmitParameters to extract the metrics from Spark Driver and Executors. This parameter config is already added to the sample Spark script used in this solution. Prometheus Server running on EKS pulls the metrics periodically. Prometheus relies on Kubernetes service discovery to find a running job and to pull and store the metrics from the application endpoint. Here is the link for available Spark metrics.
cd ~/data-on-eks/analytics/terraform/emr-eks-karpenter/examples/nvme-ssd/karpenter-memory-provisioner/

./execute_emr_eks_job.shStep 8: Monitor Spark Submit
Log in to AWS EMR Console, select the EMR Virtual Cluster, and verify the job status. This should show the status as Completed in a few minutes, and the Spark Job execution results dataset will write to the S3 bucket under the OUTPUT folder.

Execute the following command to verify the Spark job execution pod status
kubectl get pods --namespace=emr-data-team-a -wStep 9: Verify metrics collected by Prometheus Server
In this step, verify the Spark metrics collected by Prometheus Server running on EKS Cluster. Let’s run the command. This command constructs a configuration file with server and certificate authority data values for a specified EKS cluster.
aws eks --region <enter-your-region> update-kubeconfig --name emr-eks-karpenterWe are going to port-forward to the Prometheus service to verify metrics using Prometheus WebUI.
kubectl port-forward services/prometheus-server 9090:80 -n prometheusNow, open the browser and access Prometheus UI using http://localhost:9090/. Spark Executor Metrics are as follows:

Furthermore, this solution writes the metrics to Amazon Managed Service for Prometheus workspace automatically. Let’s look at querying these metrics from Amazon Grafana in the next steps.
Step 10: Setup Grafana Workspace
In this step, we will use AWS Console to create Amazon Grafana Workspace.
- Login to the AWS console and open Amazon Grafana.
- Select
Create Workspaceand enter the details as shown in the following.
Note that if you haven’t set up users via AWS SSO, then you can use the inline experience offered by Amazon Managed Grafana, and then select Create user at this step. Alternatively, you can open the AWS Single Sign-On service and create users (e.g., grafana-user). Refer to this post for more details on how to setup Amazon Managed Grafana with SSO.

The next step is to add the newly created AWS SSO user to the Grafana workspace. Select Assign new user or group button and select the previously created user grafana-user to the workspace. Make this user an Admin after adding by selecting the Make Admin button. This option lets users add data sources to the Grafana dashboard in our next steps.
Step 11: Add Amazon Managed Prometheus Workspace as a data source to Amazon Managed Grafana
It is easy to connect to Amazon Managed Prometheus using the AWS datasources tab and then explore the metrics. Open the Grafana Workspace URL in a browser. You must provide the newly created user grafana-user and the password to log in to the Workspace. Once you are logged in, you can see the Amazon Grafana Dashboard page. First, select the AWS logo on the left ribbon just above the settings link, and select Amazon Managed Service for Prometheus as a data source.
It should automatically fetch Amazon Managed Service for Prometheus Workspace created by Terraform Apply in Step 4. Next, select the correct region to deploy the EKS Cluster in Step 3 and select the Add data source button. You should see a page, as shown in the following image, with a successfully connected data source.

Step 12: Create Spark Metrics Dashboard
Finally, we arrive at the final step of creating the Grafana dashboard and monitoring the Spark Jobs. We have already created a Spark Grafana dashboard JSON file for this demo. We will copy the JSON file content from this location: ~/data-on-eks/analytics/terraform/emr-eks-karpenter/emr-grafana-dashboard/emr-eks-grafana-dashboard.json
Now, import the JSON file content into Amazon Managed Grafana. Log in to the Amazon Managed Grafana console, and select the “+” and “import” button on the left ribbon panel. Paste the copied JSON file content in the “import via panel json” text box, and select the Load button to see the Spark dashboard.
Alternatively, you can also use the open source Grafana Dashboard with ID 18387.
You should see a dashboard like the one in the following image. In addition, you can filter and monitor the Spark jobs using Virtual Cluster ID, EMR Job ID, DriverID, ExecutorID, and NodeID.

The following animated GIF shows the EMR on EKS Spark Job metrics dashboard for multiple resources.

Clean Up
To avoid unwanted charges to your AWS account, delete all the AWS resources created during this walkthrough. You can run cleanup.sh command to delete all of the resources created by this post:
cd ~/data-on-eks/analytics/terraform/emr-eks-karpenter && chmod +x cleanup.sh
./cleanup.sh
Furthermore, log in to AWS Console and delete the EMR Virtual Cluster and Amazon Managed Grafana Workspace created manually.
Conclusion
In this post, we learned to configure and run Spark jobs using EMR on EKS managed service, as well as export metrics to Prometheus Server using PrometheusServlet sink. Prometheus writes these metrics remotely to Amazon Managed Service for Prometheus. Amazon Managed Grafana is used to visualize the metrics in the live dashboard. This post also introduced an open-source Data on EKS that helps you build scalable data platforms on EKS clusters with all of the necessary add-ons, including Prometheus, and EMR on EKS Kubernetes resources.
Dealing with large volumes of Spark container workloads with a vast number of metrics requires a highly-scalable and highly-available metrics database. Amazon Managed Service for Prometheus provides a fullymanaged experience that delivers enhanced security, scalability, and availability. In addition, AWS Managed Grafana for interactive data visualization is used for monitoring and alerting. Both services share AWS security services, such as fine-grained access control and activity audit trails. This enables Data engineers, Data Scientists, and DevOps Engineers to proactively monitor and manage the Spark workloads running on EKS.