AWS Developer Tools Blog
Asynchronous Logging in Corretto 17
While working with an AWS service team to diagnose unexpected Garbage Collection (GC) pauses, the Amazon Corretto team discovered that applications were being throttled by I/O blocking while writing logs to disk. As a result, we decided to implement and contribute async-logging(JDK-8229517)) to OpenJDK 17. In this post, we’re going to explain how you can use the -Xlog:async switch and the Unified Logging (UL) framework to avoid extended GC pauses due to I/O. Subsequent to our changes, the service improved their outlier p99.99 GC pause latency from 3s to 1s.
UL is a logging framework for the Java Virtual Machine (JVM) introduced in OpenJDK 9. Many AWS services detect anomalies and subsequently take action based upon logging output from running JVMs. Logs also provide abundant details about Garbage Collection (GC) activities, helping developers to pinpoint the cause of long pauses and tune GC performance based on them.
UL is flexible in that you can change its configuration at runtime. OpenJDK users can reduce their logging overhead and save disk space with a default, terse configuration, but can dynamically increase logging output when required. For example, a developer can map an alarm trigger to code that will ask the JVM to increase logging context and verbosity when the monitored JVM crosses a given threshold. Some AWS services use this pattern to reduce default operational loads.
You can access these features using any OpenJDK distro, including Amazon’s Corretto 17. To understand how this works, let’s dive into details.
JVM Unified Logging
Unified Logging (UL) is a dynamic, tag-based logging framework for the HotSpot JVM. UL configuration is a mini language unto itself. OpenJDK users will find a formal syntax in JEP-158 and a help message using -Xlog:help, but we’ll provide the basic concepts here.
As of OpenJDK 17, developers can access hundreds of log tags that they can use to identify logging data output. Some examples of the available tag names are class, compilation, gc, metadata, and stats. These represent the object of the logging information. You can find a full list of these by running the help command noted above.
Next, you can group these tags, so that you can adjust the logging levels associated with multiple logging tags simultaneously. We call this grouping a tagset. A developer will likely see the value in being able to turn up the logging level for a number of related tags.
Then, we have the logging instrumentation. Let’s call these “log sites”. Each log site is logically associated with one tagset. Finally, we have a log selector, which is a query string you can use to match from zero to multiple tagsets along with their verbosity levels. It’s the log selector that you can use to filter the logging output.
Here an example, the log message are obtained from java -Xlog:'gc*=info:stdout'
The first log message comes from the log site below; its tagset is (gc,init). The code will only be executed when the log is selected.
The second log message has a logset ‘gc’.
‘gc=info’ only selects logsites with the tagset ‘gc’. By contrast, the wildcard is used to match all tagsets. 'gc*' will select tagset ‘gc’, ‘gc+init’ and all others with prefix gc. The log selector gc*=info' in the example breaks down into 2 parts: query things ‘gc*’ and verbosity level ‘info’.
This blog post is not a thorough tutorial of UL. Readers who are not familiar with it can read JEP-158 or this tutorial. Since OpenJDK 9, there’s been no separate GC log: it was integrated into UL. If you’ve used OpenJDK 8, you may have added XX:+PrintGC to your command line. Since OpenJDK 9, you’ve been able to select GC logs using the “gc” tag in combination with others. More details can be found in JEP-271.
Asynchronous logging
You can direct output UL to a file. Even though file I/O is buffered, log writing still cannot be guaranteed to be non-blocking because the ‘write()’ syscall depends on the implementation of a specific filesystem and the underlying physical device. E.g., Linux software RAID needs to synchronize multiple writes to different disk partitions, and a network-backed Virtual File System (VFS) may block while writing due to a slow network connection.
The HotSpot JVM has a global synchronization mechanism called a ‘safepoint’. At a safepoint, HotSpot forces all Java threads to pause. Some GC-related VM operations require a safepoint to ensure that Java threads do not mutate the Java heap while GC is running. If the UL writes to files during a safepoint and the writes happen to be delayed or blocked, then the safepoint pause time for such VM operations will be prolonged. These low-level incidents will increase application response time.
One pattern that should draw your attention to potential I/O problems is an unusual CPU time distribution. The gc,gc+cpu tagset reveals such information. In the example below, we ran the Java application with 7 concurrent GC threads. We’d expect that the “User” time associated with the thread activity would be higher than the “Real” time. However, in the log we see that the “User” time is actually smaller, which makes us suspicious. One possible explanation for this could be that some GC threads were blocked by disk I/O. Perhaps they were not in the wait queue so they would not consume CPU time.
To address the issue, the AWS Corretto Team developed a new feature called “Asynchronous Logging” (asynclog), and have added it to OpenJDK 17. When asynclog is enabled, logsites enqueue logging messages to an in-memory buffer and a dedicated, concurrent thread asynchronously flushes them to the specified output file. Log writes to the in-memory buffer are guaranteed to be non-blocking. By default, the intermediate buffer size is bounded to 2 MB, but configurable with -XX:AsyncLogBufferSize. If the buffer fills up before the asynchronous log writer thread can dump its contents to file, new log messages will be discarded. You can use the new option -Xlog:async to tell UL to run in asynclog mode.
The following two experiments show why asynclog matters for Java applications. The first shows how it alleviates the logging penalty by leveraging concurrency. The second shows how asynclog improves high-percentile latency.
Performance impact on Java HelloWorld with full UL
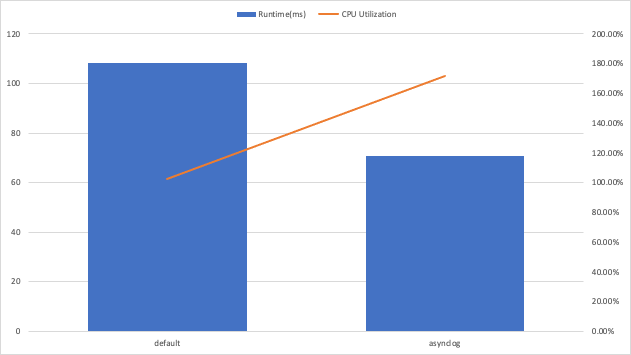
In the first experiment, we enable all=trace to produce exhaustive UL logs. This tagset covers all parts and the entire JVM lifecycle. For a typical “HelloWorld” program running on OpenJDK 17, when we enabled this option, we observed 16,219 messages for synchronous UL and 16,225 log messages for -Xlog:async. The extra log messages are from the asynclog subsystem itself. Please note that filecount=0 is a UL output option which prevents log file rotation. Here is the full Java command.
As you can see in the graph, in our experiment, asynchronous logging reduced the Real CPU time by 34.5% from 108 to 70.7ms. At the same time, we saw overall CPU utilization increase from 102.7% to 171.6%. The runtime gain is achieved by offloading the I/O task of log writing into a separate, concurrent thread. While this considerably reduces the absolute running time of the application it also increases overall CPU consumption due to overhead introduced by the additional thread.
Impact on high-percentile GC pauses
In a second experiment we ran the benchmark heapothesys/HyperAlloc on a c5d.2xlarge instance which was backed by Hard Disk Drives (HDD), which are far slower than SSD. To make the latency more obvious, we used a background script to ensure disk utilization was close to 100%. We selected all GC tagsets with ‘debug’ verbosity. Our test program created four threads with an allocation rate of 1024M/s for 180 seconds and created a gc.log output file of about 4MB.
The data show how G1 GC latency is affected by disk I/O at p99.9 when GC logs are written synchronously. Some latency outliers (red spikes), aka Hiccups, make the high-percentile GC pause time skyrocket. Asynclog is effective at curbing the impact of disk I/O, so even at p99.999 the latency remains below 15ms.

Dynamic Configuration
OpenJDK users can change UL configuration on the fly even if they do not set up UL arguments on the Java command line. jcmd is a standalone tool which sends diagnostic commands (dcmds) to HotSpot. HotSpot has a thread called AttachListener, which listens on a local socket and processes incoming dcmds. For UL, the VM.log dcmd can display the current UL settings and change them. The following table shows the arguments of VM.log.
| VM.log | Description | Note |
| output | The name or index (#<index>) of output to change. | UL will create a new output if it’s new. otherwise, it just updates ‘what’ and ‘decorators’ for the existing one. |
| output_options | Options for the output. | can not change for an existing output. |
| what | Log selector for the output | |
| decorators | Decorators for the output. Use ‘none’ or an empty value to remove all. | |
| disable | Subcommand: disable all unifed logging outputs | |
| list | Subcommand: list current log configuration | |
| rotate | Subcommand: rotate all logs |
Assuming you have a Java application started whose PID is 85254. You can use VM.log to add a new log output.
gc=debug instructs UL to select log entries with the tag gc and a verbosity that is equal or higher than debug. The output goes to the file gc.log. When this dcmd completes, you will start observing the GC log in the file. You can use the list sub-command to verify that the log output has been updated.
Java users can increase the log verbosity or expand the tagset if more information is needed. E.g.,
output=#2 refers to the prior output file gc.log. gc* is a log selector with a wildcard. It matches all tagsets with gc, which is broader than before. Meanwhile, the verbosity level has increased from debug to trace. Here is a sample of logs after this adjustment.
Java developers can also control UL programmatically right from their application because the dcmd functionality has been exposed as a MXBean. First of all, Java applications need to enable JMX.
The following procedure reconfigures output #2 via JMX. The effect is same as the prior jcmd command. Please note that authentication and SSL are ignored for simplicity. That is not a good practice, but this is a demo.
Testing it yourself
If you’d like to experiment yourself with Async logging, you can follow the instructions below. Please ensure you have Corretto 17 or later installed, as the Asynchronous logging feature was added in Corretto 17.
Now write HelloWorld Java Application in HelloWorld.java
Windows (In Powershell, create a time function to measure the elapsed time it takes to execute the application)
On MacOS, Linux, and Windows (Using Powershell)
Please note that the output below was obtained via Windows Powershell.
You’ll want to run the above experiment a number of times to get a good average.
Conclusion
This blog introduced a new Unified Logging features in OpenJDK and Corretto 17. Asynchronous logging reduces application pauses due to UL by decoupling logging from disk I/O. Dynamic configuration, which has been available since OpenJDK 9, provides true on-demand logging to avoid the constant overhead of UL until it is really needed. They are orthogonal, so Java users can use them independently.