Containers
Metrics and traces collection using Amazon EKS add-ons for AWS Distro for OpenTelemetry
Introduction
Amazon Elastic Kubernetes Service (Amazon EKS) is a managed service that offloads from its users the onerous task of managing the Kubernetes control plane. It gives users the flexibility to install tools they need to manage their application workloads on the data plane. However, many customers want us to manage some of these tools that are critical for the so-called Day-2 operations of their clusters. These include tools for cluster networking like the Amazon VPC CNI, as well as tools to monitor their workloads. EKS add-ons was introduced in December 2020 to provide lifecycle management for such operational software. An add-on is software that provides operational capabilities in an EKS cluster that makes it easy for users to operate production-grade clusters in a stable and secure manner.
AWS Distro for OpenTelemetry (ADOT) is a secure, AWS-supported distribution of the OpenTelemetry project. Users can instrument their applications just once and, using ADOT, send correlated metrics and traces to multiple monitoring solutions. Amazon EKS now allows users to enable ADOT as an add-on at any time after the cluster is up and running. The ADOT add-on includes the latest security patches and bug fixes and is validated by AWS to work with Amazon EKS. In this blog post, we will take a look at how to install the ADOT add-on in an EKS cluster and then use it to collect metrics and traces from application workloads deployed to the cluster.
EKS add-ons for ADOT is now generally available. With ADOT, tracing support is generally available, metrics support is in preview, and logs support is in alpha.
Overview of ADOT Collector
OpenTelemetry is a set of APIs, SDKs, and tools that are designed for the creation and management of telemetry data such as traces, metrics, and logs. AWS Distro for OpenTelemetry Collector (ADOT Collector) is an AWS-supported version of the upstream OpenTelemetry Collector that is fully compatible with AWS computing platforms, including EKS. It enables users to send telemetry data to AWS managed services such as Amazon CloudWatch, Amazon Managed Service for Prometheus, and AWS X-Ray.
The ADOT Collector has the concept of a pipeline that comprises three key types of components, namely, receiver, processor, and exporter. A receiver is how data gets into the collector. It accepts data in a specific format, translates it into the internal format, and passes it to processors and exporters defined in the pipeline. It can be pull- or push-based. A processor is an optional component that is used to perform tasks such as batching, filtering, and transformations on data between being received and being exported. An exporter is used to determine which destination to send the metrics, logs, or traces to. The collector architecture allows multiple instances of such pipelines to be set up via a Kubernetes YAML manifest.
The following diagram illustrates an ADOT Collector configured with two pipelines, which sends telemetry data to different destinations. The traces pipeline comprises an instance of AWS X-Ray Receiver and AWS X-Ray Exporter and sends traces to AWS X-Ray. The metrics pipeline comprises a Prometheus Receiver, a processor, and an AWS Prometheus Remote Write Exporter that sends metrics data to a workspace in Amazon Managed Service for Prometheus.

Let’s delve into the details of installing the ADOT add-on in an EKS cluster and then collect telemetry data from workloads. The following is a list of prerequisites needed before we can install the ADOT add-on.
- An EKS cluster supporting Kubernetes version 1.19 or higher. You may create the EKS cluster using one of the approaches outlined here.
- Certificate Manager, if not already installed in the cluster. It can be installed with the default configuration as per this documentation. Make sure that you are using version < 1.6.0 (1.6.0 is not supported).
- Kubernetes RBAC permissions specifically for EKS add-ons to install the ADOT add-on in your cluster. This can be done by applying the settings in this YAML file to the cluster using a CLI tool such as kubectl.
You can check the list of add-ons enabled for different versions of EKS using the following command:
aws eks describe-addon-versions
The JSON output should list the ADOT add-on among others, as shown below. Note that when an EKS cluster is created, EKS add-ons does not install any add-ons on it.
{
   "addonName":"adot",
   "type":"observability",
   "addonVersions":[
      {
         "addonVersion":"v0.45.0-eksbuild.1",
         "architecture":[
            "amd64"
         ],
         "compatibilities":[
            {
               "clusterVersion":"1.22",
               "platformVersions":[
                  "*"
               ],
               "defaultVersion":true
            },
            {
               "clusterVersion":"1.21",
               "platformVersions":[
                  "*"
               ],
               "defaultVersion":true
            },
            {
               "clusterVersion":"1.20",
               "platformVersions":[
                  "*"
               ],
               "defaultVersion":true
            },
            {
               "clusterVersion":"1.19",
               "platformVersions":[
                  "*"
               ],
               "defaultVersion":true
            }
         ]
      }
   ]
}Wait until the add-on is in ACTIVE status before proceeding to the next step. The status of the add-on can be checked using the following command.
aws eks describe-addon --addon-name adot --cluster-name $CLUSTER_NAME
Deploying the ADOT Collector
The ADOT add-on is an implementation of a Kubernetes Operator, which is a software extension to Kubernetes that makes use of custom resources to manage applications and their components. The add-on watches for a custom resource named OpenTelemetryCollector and manages the lifecycle of an ADOT Collector based on the configuration settings specified in the custom resource. The following figure shows an illustration of how this works.
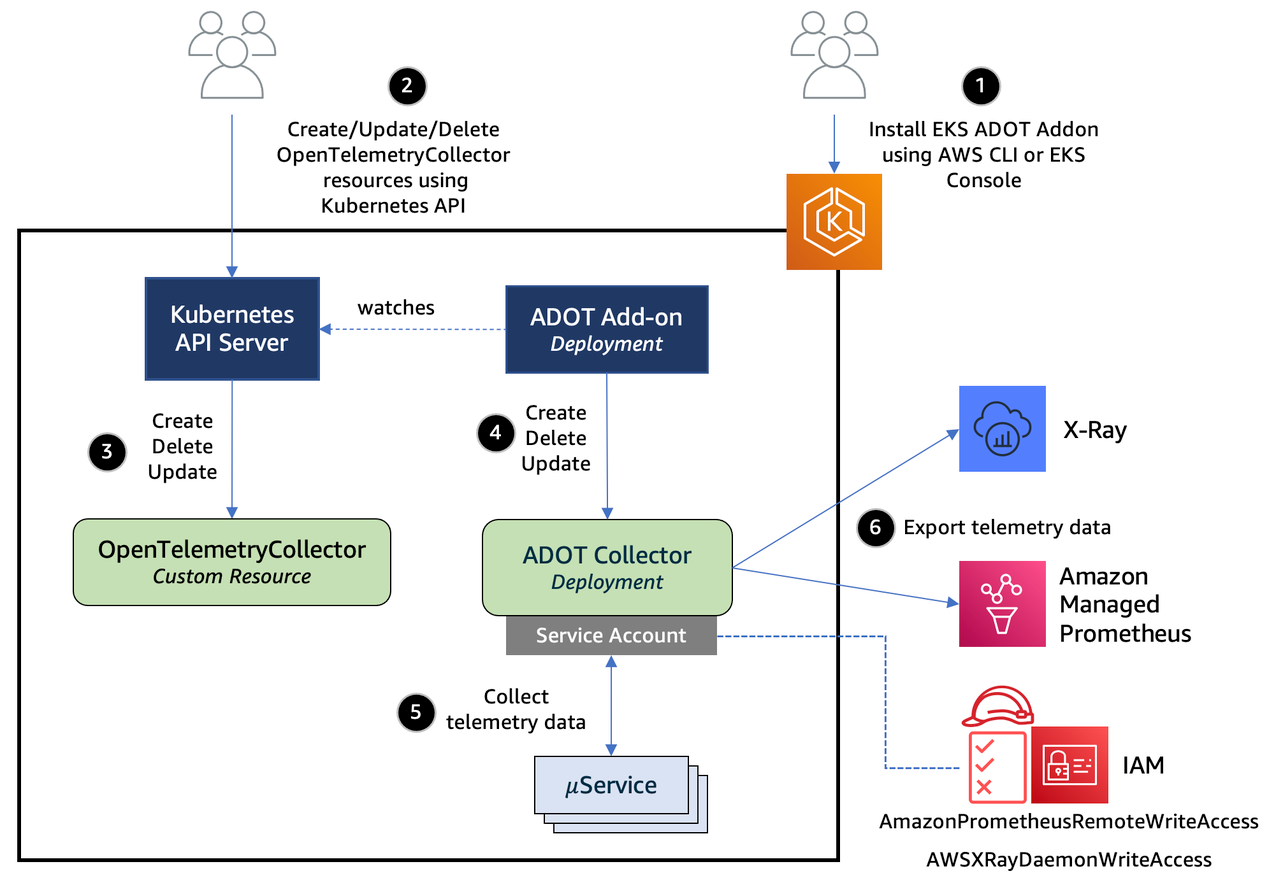
Next, let’s take a look at how to deploy an ADOT Collector. The YAML configuration file here defines an OpenTelemetryCollector custom resource. When deployed to an EKS cluster, this will trigger the ADOT add-on to provision an ADOT Collector that includes a traces and metrics pipelines with components, as shown in the first illustration above. The collector is launched into the aws-otel-eks namespace as a Kubernetes Deployment with the name ${custom-resource-name}-collector. A ClusterIP service with the same name is launched as well. Let’s look into the individual components that make up the pipelines of this collector.
The AWS X-Ray Receiver in the traces pipeline accepts segments or spans in X-Ray Segment format, which enables it to process segments sent by microservices instrumented with X-Ray SDK. It is configured to listen for traffic on UDP port 2000 and is exposed as a Cluster IP service. Per this configuration, workloads that want to send trace data to this receiver should be configured with the environment variable AWS_XRAY_DAEMON_ADDRESS set to observability-collector.aws-otel-eks:2000. The exporter sends these segments directly to X-Ray using the PutTraceSegments API.
The Prometheus Receiver in the metrics pipeline is meant to minimally be a drop-in replacement for a Prometheus server and is capable of scraping metrics from microservices instrumented with Prometheus client library. It supports the full set of Prometheus configurations, including service discovery. The AWS Prometheus Remote Write Exporter employs the remote write feature and transparently sends metrics data to an existing workspace under Amazon Managed Service for Prometheus for long-term storage.
From a security standpoint, the Prometheus Receiver used in the configuration requires Kubernetes RBAC permissions to list resources like nodes, services, endpoints, and pods across all namespaces in the cluster. In order to enable this, the ADOT Collector is configured to be launched under the identity of a Kubernetes service account named aws-otel-collector, which is granted these permissions using a ClusterRoleBinding and ClusterRole, also shown in the configuration. The exporters need IAM permissions to send data to X-Ray, Amazon Managed Service for Prometheus, and CloudWatch. This is done by associating the service account with an IAM role using the IAM roles for service accounts feature supported by EKS. The IAM role should be associated with the AWS-managed policies AWSXRayDaemonWriteAccess, AmazonPrometheusRemoteWriteAccess, and CloudWatchAgentServerPolicy. The helper script here may be used, after setting the CLUSTER_NAME and REGION variables, to create an IAM role named EKS-ADOT-ServiceAccount-Role that is granted these permissions and is associated with the aws-otel-collector service account.
End-to-end test of metrics and traces collection
Let’s now put all this together and test metrics and traces collection from workloads deployed to an EKS cluster. The following illustration shows the setup employed for this test. It comprises a front-end service that exposes a set of REST APIs and interacts with S3 as well as a datastore service that, in turn, interacts with an instance of Aurora PostgreSQL database. The services are instrumented with both Prometheus client library and X-Ray SDK. ADOT Collector is launched in Deployment mode by deploying an OpenTelemetryCollector custom resource using the YAML manifest that was discussed in the last section. Postman client is used as an external traffic generator, targeting the front-end service.

The ADOT Collector scrapes a Prometheus Counter named metric http_requests_total from the front-end service and sends it to Amazon Managed Service for Prometheus. The rate of HTTP requests processed is computed from this metric using a PromQL expression sum(rate(http_requests_total[5m])) and displayed in Amazon Managed Grafana as shown in the following graph.

The following image shows the service graph generated by X-Ray using the segment data captured from the services, with the average response latency for each segment.

Customers that want to use Amazon CloudWatch for collecting their metrics may deploy an OpenTelemetryCollector custom resource using the YAML configuration file here. When deployed to an EKS cluster, this will trigger the ADOT add-on to provision an ADOT Collector illustrated in the following figure. The collector has a traces pipeline that is identical to the one deployed in the previous example. The metrics pipeline uses a Prometheus Receiver with the same scrape configuration as in the previous example to collect metrics, but uses the AWS CloudWatch EMF Exporter to convert the metrics data into performance log events with embedded metric format (EMF) and then sends it directly to a CloudWatch log group using the PutLogEvents API. From this data, CloudWatch creates an aggregated custom metric named http_requests_total, which is made available under the CloudWatch Metrics namespace ContainerInsights/Prometheus with the dimensions EKS_Cluster, EKS_Namespace, and EKS_PodName per the exporter configuration settings.

The rate of HTTP requests is computed using metric math expression and displayed in the CloudWatch metrics dashboard shown in the following image.

Collector configuration templates
The OpenTelemetryCollector custom resource definitions that pertain to different pipeline configurations are listed below. Customers that want to use ADOT Collector in conjunction with Amazon Managed Service for Prometheus, Amazon CloudWatch and AWS X-Ray may start with these configuration templates, replace the placeholder variables with values based on their target environments and quickly deploy the collector to their Amazon EKS clusters using EKS add-on for ADOT.
- Metrics pipeline with Prometheus Receiver and AWS Remote Write Exporter sending metrics to a workspace in Amazon Managed Service for Prometheus
- Metrics pipeline with Prometheus Receiver and AWS CloudWatch EMF Exporter sending metrics for CloudWatch
- Traces pipeline with OTLP Receiver and AWS X-Ray Exporter sending traces to AWS X-Ray
Concluding remarks
This blog presented an overview of the design of EKS add-ons for ADOT and how the add-on employs an ADOT Operator to manage the lifecycles of one or more instances of an ADOT Collector in an EKS cluster. It also demonstrated how to package the relevant configuration settings as an OpenTelemetryCollector custom resource and trigger the add-on to provision collector instances that send traces to AWS X-Ray and metrics to Amazon Managed Service for Prometheus and Amazon CloudWatch.
ADOT offers AWS customers the ability to reduce the installation footprint of observability tools in their environments. A single instance of an ADOT Collector can be configured to collect telemetry data from application workloads in a cluster and then export them to a diverse set of destinations for subsequent analysis and long-term storage. Understanding how to configure various components that make up the traces, metrics, and logs pipelines in an ADOT Collector could be a challenge. EKS add-ons for ADOT addresses this issue by enabling a simplified experience for customers that want to deploy multiple monitoring services to their EKS clusters. The AWS vended configuration templates provide customers a quick onramp to getting started with ADOT. Customers may customize these templates per their needs before deploying them to their EKS clusters.
Customers are encouraged to review the Getting Started with ADOT using EKS add-ons guide, deploy ADOT to their EKS clusters, and collect telemetry data from their workloads. Please provide feedback on your experience with employing ADOT using EKS add-ons for your observability needs and what additional features you would like with this add-on. On the AWS Containers Roadmap, you may review our roadmaps and provide feedback about what additional add-ons you would like EKS add-ons to support.