I am usually not a big fan of benchmarks, but this one is interesting for multiple reasons:
- it is published by a consulting company and not by a vendor
- it reproduces a modern use-case (IoT ingest from sensors) where both SQL and NoSQL alternatives are valid
- they optimize for each database, so that it also documents the best configuration for this workload. I've contributed to optimize for PostgreSQL and for YugabyteDB
The benchmark is here:
https://github.com/MaibornWolff/database-performance-comparison
and this blog post shows how to run it on AWS Kubernetes
I start an EKS cluster with 32 vCPU and 64GB across 4 nodes:
eksctl create cluster --name yb-demo3 --version 1.21 \
--region eu-west-1 --zones eu-west-1a,eu-west-1b,eu-west-1c \
--nodegroup-name standard-workers --node-type c5.2xlarge \
--nodes 4 --nodes-min 0 --nodes-max 4 --managed
This is smaller than the cluster used my MaibornWolff to publish their results among different databases, but that's not a problem. I know the scalability of YugabyteDB and prefer that user go to an independent test results.
I move to the MaibornWolff project:
git clone https://github.com/MaibornWolff/database-performance-comparison.git
cd database-performance-comparison
I install YugabyteDB with limited resources to fit my cluster (the original CPU declaration is 2 for the masters and 7 for the tservers) but, again, I'm not looking at the throughput, just checking that all configuration is optimal.
helm install yugabyte yugabytedb/yugabyte -f dbinstall/yugabyte-values.yaml \
--set storage.master.storageClass=gp2,storage.tserver.storageClass=gp2 \
--set resource.master.requests.cpu=0.5,resource.tserver.requests.cpu=4 \
--set gflags.master.enable_automatic_tablet_splitting=false \
--set gflags.tserver.enable_automatic_tablet_splitting=false \
--version 2.15.1
Note that I also disable tablet splitting, as you don't want to start with one tablet and have autosplit kick-in in during a benchmark. Without it and with all num_shards and num_tablets by default, the hash sharded table will be split into one tablet per cpu (for example 12 in 3 servers with 4 vCPUs per server). I'll probably submit a PR to get auto-split disabled from the yugabyte-values.yaml
I verify that all started and display the url of the console:
kubectl get all
echo $(kubectl get svc --field-selector "metadata.name=yb-master-ui"  -o jsonpath='http://{.items[0].status.loadBalancer.ingress[0].hostname}:{.items[0].spec.ports[?(@.name=="http-ui")].port}')
I also check the flags used to start the yb-master and yb-tserver:
time python run.py insert --target yugabyte_sql -w 1 -r 1 \
 --clean --batch 1000 --primary-key sql \
 --num-inserts 31250000
While this is running, I display some statistics:
kubectl exec -i yb-tserver-0 -c yb-tserver --\
 /home/yugabyte/bin/ysqlsh -h yb-tserver-0.yb-tservers.default \
 -d postgres <<'SQL'
\! curl -s https://raw.githubusercontent.com/FranckPachot/ybdemo/main/docker/yb-lab/client/ybwr.sql > ybwr.sql
\i ybwr.sql
SQL
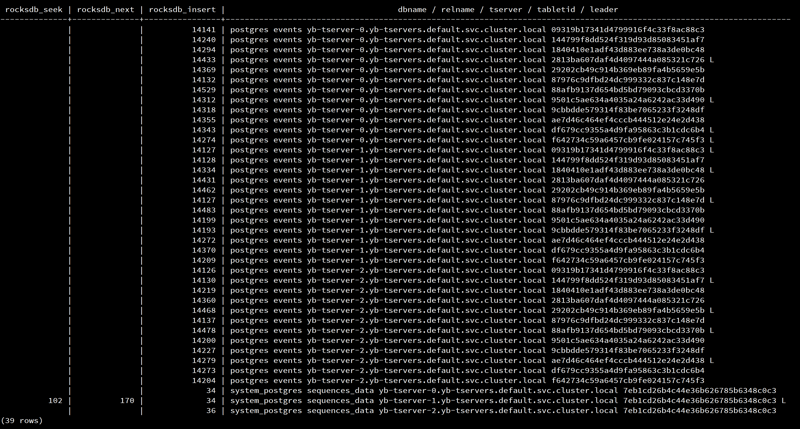
This is important to understand the performance. We have no reads here, only writes: insert into the DocDB LSM-Tree. This is because the connection defines yb_enable_upsert_mode=on: we don't check for existing rows. Please, do not set that blindly for any program. Here, because I insert with a sequence, I will never have duplicates, so no need to check conflicts on the primary key. There are some reads, and updates, on the sequence, but thanks to the caching the overhead is negligible. YugabyteDB combines the scalability of NoSQL (fast ingest) with all SQL features (sequence here).
The result of the insert shows the thoughput, here 38500 rows inserted per second from a single worker:
 Workers Min     Max     Avg
 1       38570   38570   38569
I check that all rows are there:
kubectl exec -it yb-tserver-0 -c yb-tserver --\
 /home/yugabyte/bin/ysqlsh -h yb-tserver-0.yb-tservers.default \
 -d postgres -c "
select count(*) from events
"

  count
----------
 31250000
(1 row)
I'll continue this series with the Query part. This one is about the most important in IoT: scalable data ingest.
cleanup
To cleanup the lab, you can scale down to zero nodes (to stop the EC2 instances), deinstall the benchmark deployment (to tun it again), deinstall YugabyteDB (and remove the persistent volumes), remove the CloudFormation stacks used by EKS, and terminate the Kubernetes cluster
# scale down to stop nodes
eksctl scale nodegroup --cluster=yb-demo3 --nodes=0  --name=standard-workers

# deinstall the benchmark
helm delete dbtest

# deinstall yugabyte
kubectl delete pvc --all
helm delete yugabyte

# cleanup CloudFormation stacks
aws cloudformation delete-stack --stack-name eksctl-yb-demo3
aws cloudformation delete-stack --stack-name eksctl-yb-demo3-cluster
aws cloudformation delete-stack --stack-name eksctl-yb-demo3-nodegroup-standard-workers
eksctl delete cluster --region=eu-west-1 --name=yb-demo3
The results
For the results of the benchmark, they are on
https://github.com/MaibornWolff/database-performance-comparison#insert-performance
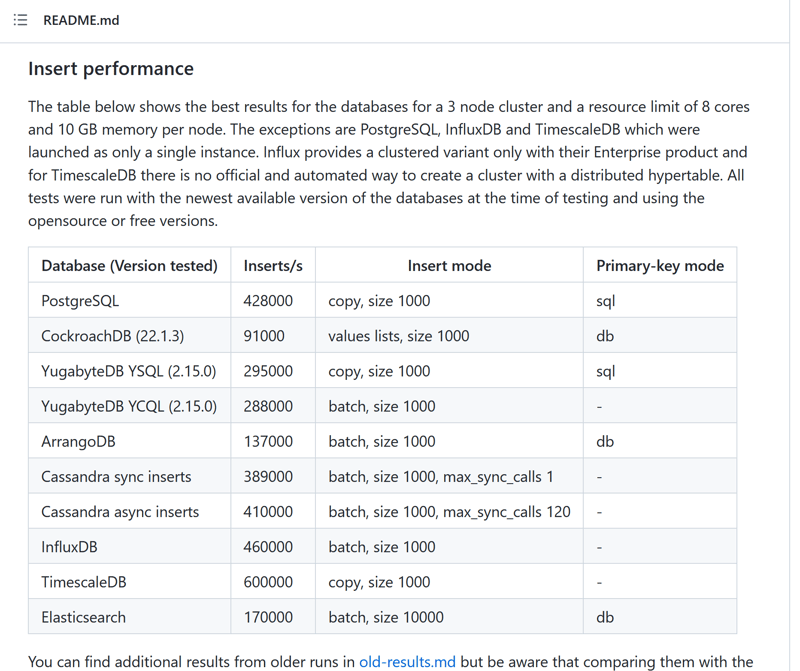
Note that you can use it to test on managed databases, just by changing the connection string in config.yaml like Aurora, or your own deployment of YugabyteDB or other. The calls are batched, and you can run many workers.


Top comments (0)