AWS Cloud Operations & Migrations Blog
Monitoring Windows desktops on Amazon Workspaces using Amazon Managed Service for Prometheus and Amazon Managed Grafana
Many Organizations leverage Amazon Workspaces as a virtual cloud-based Windows desktop as a solution (DAAS) to replace their existing traditional desktop solution to shift the cost and effort of maintaining laptops and desktops to a cloud pay-as-you-go model. Customers using Amazon Workspaces would need the support of managed services to monitor their workspaces environment operations. A cloud-based managed open source monitoring solution, such as Amazon Managed Service for Prometheus and Amazon Managed Grafana, helps IT teams to quickly set up and operate a monitoring solution to save costs. Monitoring CPU, memory, network, or disk activity from Amazon Workspaces eliminates guesswork while troubleshooting in real time or after the issue for the Amazon Workspaces environment.
A managed monitoring solution for your Amazon Workspaces Windows OS environments yields the following organizational benefits:
- Service desk staff can quickly identify and drill down to Amazon Workspaces issues that need investigation.
- Service desk staff can investigate Amazon Workspaces issues after the event using the historical data in Amazon Managed Service for Prometheus.
- Service desk teams can shorten or eliminate long calls that waste time questioning business users on Amazon Workspaces issues.
In this post, we’ll set up Amazon Managed Service for Prometheus, Amazon Managed Grafana, and a Prometheus server on Amazon Elastic Compute Cloud (Amazon EC2) to provide a monitoring solution for Amazon Workspaces. We’ll automate the deployment of Prometheus agents on any new Amazon Workspaces using Active Directory Group Policy Objects (GPO).
Solution Architecture
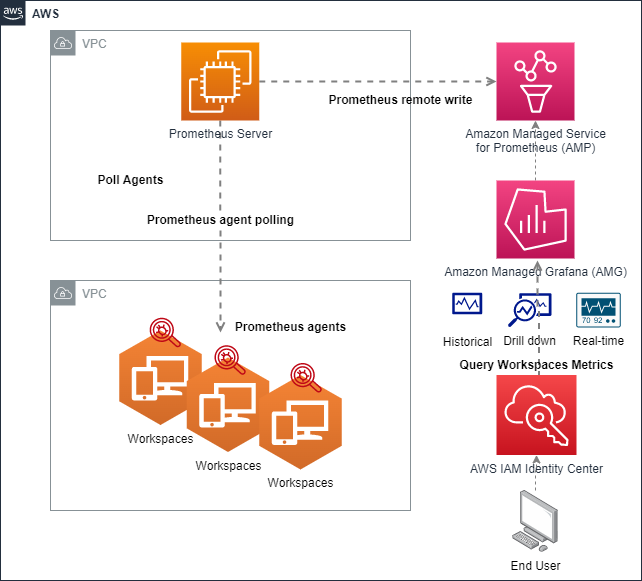
The following diagram demonstrates the solution to monitor your Amazon Workspaces environment using AWS native managed services, such as Amazon Managed Service for Prometheus and Amazon Managed Grafana. This solution will deploy a Prometheus server on an Amazon EC2 instance which polls Prometheus agents on your Amazon Workspaces Windows 10 instances periodically, and remote writes metrics to Amazon Managed Service for Prometheus. The EC2 is necessary to pull in the data from Workspaces and forward it to Amazon Managed Service for Prometheus. We’ll be using Amazon Managed Grafana to query and visualize metrics on your Amazon Workspaces infrastructure.
Solution Walkthrough
These steps will deploy the solution in your environment.
Prerequisites
You’ll need the following to complete the steps in this post:
- AWS Command Line Interface (AWS CLI)
- An Amazon WorkSpaces environment. You can use this quickstart to create one.
- An AWS Directory Service for Microsoft Active Directory joined EC2 or Workspaces with Active Directory Administration tools including the group policy editor tools.
- An Active Directory Administrator or AWS Admin is needed for GPO creation and deployment.
Creating AWS resources for our solution
Let’s start by setting a few environment variables in the AWS CLI:
We’ll utilize a default Windows Workspaces bundle for this solution. You can review and pick choices from available Workspaces bundles CLI command.
Next, we’ll be using prometheusmonitoring.sh shell scripts from the aws-o11y-recipes GitHub repository to create the required AWS resources required for this demonstration. Follow these commands:
The above automation script will create the following resources for our solution demonstration:
- AWS networking resources, such as Amazon Virtual Private Cloud (Amazon VPC), a public subnet, an Internet Gateway (IGW), a VPC peering connection with Workspaces VPC, route table configurations, and Security Groups
- An AWS Identity and Access Management (IAM) Role and an IAM Instance profile for the Amazon EC2 instance for Prometheus
- An Amazon EC2 instance for deploying Prometheus components on the above AWS network with the above IAM instance profile
- Amazon Workspaces with Windows 10 operating system
- An Amazon Managed Service for Prometheus workspace
- Assigns Security Groups to Amazon Workspaces and Amazon EC2 instance
Wait for few minutes before the prometheusmonitoring.sh script completes. You can modify the prometheusmonitoring.sh accordingly for your needs for different CIDRs, existing VPCs, or other changes.
Testing Amazon Managed Service for Prometheus Workspace
To test whether Amazon Managed Service for Prometheus is ready for metrics, use awscurl. This tool enables you to send HTTPS requests through the command line with AWS Sigv4 authentication. Therefore, you must have AWS credentials set up locally with the correct permissions to query from Amazon Managed Service for Prometheus. For instructions on installing this tool, see awscurl.
Configuring Prometheus on the Amazon EC2 Server
First, run the following code to obtain your Workspaces IP addresses for the Prometheus server:
Next, we must configure Prometheus on the Amazon EC2 instance to remote write metrics to Amazon Managed Service for Prometheus. The following code will add the Amazon Managed Service for Prometheus URL to the /etc/prometheus/prometheus.yml file for remote writing metrics. You must connect to your EC2 Prometheus server and log on using the keypair created by our automation.
Active Directory Setup with Group policies to push Prometheus agents to Amazon Workspaces
Log in to your Amazon Workspaces created by the automation using Amazon Workspaces client or Amazon Workspaces web access. A Group Policy Object can be used to install the Windows Prometheus Exporter agent. Download the latest Windows Exporter for use and save locally on the Amazon Workspaces that you’re using to prepare the GPO. This can be performed in Powershell with the following command, and the resultant file will be placed in C:\Temp.
Next, you’ll install the downloaded software on this Amazon Workspaces to use a template for all of the other Workspaces. Navigate to the location of the software and install by double-clicking on the .msi file.

Then, verify the Windows_exporter service is installed by checking the Windows Service listing. Type Services in the search box, and verify that the windows_exporter is listed as a service.
Continue by following these steps to create the Group Policy Object to install the Prometheus Windows Exporter to all Amazon Workspaces. Upload the Prometheus Windows Exporter MSI to a share accessible by all Amazon Workspaces. Note the location over the network. This is usually in a format such as \\servername\sharename. If you’re unfamiliar with setting up Windows Shares over Active Directory, then we encourage you to use Amazon FSx for Windows File Serverfor this by leveraging Use Case 2 in the post.
Access the Group Policy Management Tool with a Windows Admin permission account by opening the Group Policy Management tool. Create a new Group Policy by right-clicking and selecting new. Right-click on the new GPO, and select Edit.

Navigate to Computer Configuration > Policies > Software Settings and create a new software installation with a right-click, and then select New Package.

Create a Software Installation configuration using the share that is accessible for every Amazon Workspaces in the Active Directory Domain. Browse to the share created previously and select the Windows Exporter MSI file. Note that the drive path is a network format of \\servername\sharename and not a local drive path (such as C:).

You can see the Group Policy Management Editor shows the Share path in the Source path.

Create a Services action to set an automatic (delayed start) and apply a restart service action to the Prometheus Exporter agent. Navigate to Computer Configuration > Preferences > Control Panel Settings > Services as shown in the following screenshot:

Next, select New Service:

Next, select the three dot button, and then select windows_exporter:

Next, change the Startup to Automatic (Delayed Start):

Next, select the Recovery Tab and select Restart the Service three times as shown in this screenshot:

Exit the GPO Editor by selecting the X in the top right. Right-click on the Organizational Unit (OU) that contains the Amazon Workspaces in the Group Policy Management tool, and then select Link an Existing GPO:

Next, select the Group Policy that you just created for linking to the Workspaces OU, and select OK.

Next, right-click and verify the GPO is Enforced and Link Enabled. This will make sure that the software is installed on Workspaces. Exit the Group Policy Management tool.

After the GPO is linked to the Workspaces OU, Amazon Workspaces will automatically install the software on the next reboot or Group Policy replication cycle, as long as they are in the Workspaces OU in Active Directory.
If you wish to apply a group policy without waiting for replication, you can update a group policy on an Amazon Workspaces by running the following statement on the command line on your Windows 10 Amazon Workspaces Instance. The Group Policy updates will apply immediately, and the Windows 10 OS may need to be rebooted:
gpupdate /force
Amazon Managed Grafana Setup
Two steps are necessary for setting up AWS IAM Identity Center, setting up and logging in to Amazon Managed Grafana, and querying metrics from Amazon Managed Service for Prometheus workspace from the post. To set up Authentication and Authorization, follow the instructions in the Amazon Managed Grafana User Guide for enabling AWS IAM Identity Center. Second, setup the data source for Amazon Managed Service for Prometheus. You may also reference Monitor Istio on EKS using Amazon Managed Prometheus and Amazon Managed Grafana blog, starting from the AWS Single Sign-On (SSO) section for Amazon Managed Grafana setup.
Querying Windows Metrics
Let’s import a Grafana dashboard which lets us visualize metrics from the Windows 10 instances in Workspaces. Go to the plus sign on the left navigation bar, and select Import as shown in the following:

In the Import screen, type 12422 in the Import via grafana.com textbox and select the Prometheus data source in the drop-down at the bottom. Then, select Import. Once complete, you can see the Grafana dashboard showing metrics from the Amazon Workspaces through Amazon Managed Service for Prometheus data source as shown in the following. The Workspaces IP addresses will be selectable by a dropdown box in the upper-left.

Troubleshooting
This solution has many components that require the correct networking to communicate. The following are some of the troubleshooting tips in case of any issues in this setup:
- The network path must be open between the Prometheus EC2 Server, VPCs, Amazon Workspaces, and Amazon Service for Prometheus Service. Typical network troubleshooting tools should be used like VPC Reachability Analyzer, ping, and traceroute. Remember to verify Security groups and Network Access Control Lists (NACL) on your VPC on the network path.
- Performance is memory intensive and you may need to adjust your Amazon EC2 type to reflect your specific environment. The AWS Compute Optimizer should be leveraged for your environment.
- The EC2 Prometheus Server stores data from Amazon Workspaces. With several hundred Workspaces exporters, data storage can reach several gigabytes in the default configuration. The EC2 instance’s configuration retains four hours. . If you use more data than expected, then adjust the retention time and restart the systemd Prometheus service. The data is stored in the
/var/lib/prometheus/file path. The solution leverages the scalability of Amazon Managed Service for Prometheus to store and process the data. - To test whether Amazon Managed Service for Prometheus received the metrics, use
awscurl. Please refer to the instructions in the Testing Amazon Managed Service for Prometheus Workspace for setup.
- To verify the Prometheus EC2 Server, check the server URL
http://PROMETHEUSFORWARDERSERVER:9090/targetsto see that targets are appearing. This verifies that the endpoints are configured and shows their status. This URL should be used from a Windows 10 WorkSpaces where the security group allows access to this port on the Amazon EC2 server. - To verify that Amazon Managed Service for Prometheus and Amazon Managed Grafana are working fine, you can check that the data is coming in from the forwarder server by doing manual queries in Grafana. To confirm that the data from the Prometheus EC2 forwarder is arriving in the Amazon Managed Service for Prometheus workspace by running a PromQL command in Grafana by using the following instructions:
Choose Explore from the menu on the left in the Grafana Console and use the Metrics Browser to find process_cpu_seconds_total, and then select the blue box labeled Use Query at the bottom. Make sure that your Data Source is selected in the top drop-down box to the right of the Explore icon.

Next, you should see data in the graph results. If you don’t see data after a few minutes, then there is a problem in the data flow which you might have to troubleshoot.

Cleaning Up
You will continue to incur costs until you delete the infrastructure that you created for this post. Use the following commands to clean up the created AWS resources for this demonstration. We’ve created a cleanup.sh script located in the cloned repo. Use this script to remove all of the AWS services created by this solution. Make sure to verify that the variables used to create the solution are established before running the cleanup.
Second, delete the Amazon Workspaces environment you created using the quickstart. The steps are in the Workspaces documentation. If you wish to keep the Amazon Workspaces environment, delete the GPO from your Active Directory environment to avoid the installation of Prometheus exporter.
Finally, navigate to the Amazon Managed Grafana console to delete the created Amazon Managed Grafana workspace.
Conclusion
In this post, we demonstrated a solution to monitor your Amazon Workspaces environment using AWS native managed services, such as Amazon Managed Service for Prometheus and Amazon Managed Grafana. This solution deployed a Prometheus server on the Amazon EC2 instance, which polls the Prometheus agents on your Amazon Workspaces environment periodically and remote writes metrics to Amazon Managed Service for Prometheus. We used Active Directory group policies in this solution to make a seamless deployment of Prometheus Agents to new Amazon Workspaces. We also used Amazon Managed Grafana to query and visualize metrics on your Amazon Workspaces infrastructure. Learn even more about monitoring your EC2 instances using Amazon Managed Service for Prometheus. For more information and hands-on experience with Amazon Managed Grafana, check out the interactive and immersive One Observability Workshop.