AWS Cloud Operations & Migrations Blog
Introducing vended logs for Amazon Managed Service for Prometheus
Customers are using Amazon Managed Service for Prometheus to monitor and alert on their container metrics. Amazon Managed Service for Prometheus ships with Alert Manager, the open source alert routing component in Prometheus. Alert manager routes alerts to Amazon Simple Notification Service (Amazon SNS). However, there are some common reasons why alert manager may fail to send an alert, including not having the correct permissions, having an invalid alert manager template, and rule evaluation failures. I will demonstrate how you can troubleshoot your alert manager pipeline via vended logs to correct these common misconfigurations.
An Amazon Managed Service for Prometheus workspace is a logical space dedicated to the storage and querying of Prometheus metrics. Once a workspace evaluates a rule, alert manager will send the alarm to an SNS topic. However, under certain conditions, alert manager may fail to send an alarm. Let’s look at a common scenario that may cause an alarm to fail to send. By enabling vended logs, you can gain greater visibility into exactly what is happening
Solution overview
I’ve created an example workload to demonstrate just how you can use logs with Amazon Managed Service for Prometheus to troubleshoot alert manager configuration issues. In this example, I’ve set up a new workload running within an Amazon Elastic Kubernetes Service (EKS) cluster. The workload consists of two pods that are being scraped, and metrics are being remotely written to an Amazon Managed Service for Prometheus workspace. Furthermore, I’ve set up some rules to alert on high or low CPU utilization. My alerting rules look like the following:
groups:
- name: example
  rules:
  - alert: HostHighCpuLoad
    expr: 100 - (avg(rate(node_cpu_seconds_total{mode="idle"}[2m])) * 100) > 60
    for: 5m
    labels:
      severity: warning
      event_type: scale_up
    annotations:
      summary: Host high CPU load (instance {{ $labels.instance }})
      description: "CPU load is > 60%\n  VALUE = {{ $value }}\n  LABELS = {{ $labels }}"
  - alert: HostLowCpuLoad
    expr: 100 - (avg(rate(node_cpu_seconds_total{mode="idle"}[2m])) * 100) < 30
    for: 5m
    labels:
      severity: warning
      event_type: scale_down
    annotations:
      summary: Host low CPU load (instance {{ $labels.instance }})
      description: "CPU load is < 30%\n  VALUE = {{ $value }}\n  LABELS = {{ $labels }}"
YAML
Furthermore, I’ve configured alert manager to send the alerts to an Amazon SNS topic. The alert manager configuration looks like the following:
alertmanager_config: |
  route:
    receiver: default_receiver
    repeat_interval: 5m

  receivers:
    - name: default_receiver
      sns_configs:
        - topic_arn: arn:aws:sns:us-east-1:1234567890:my_sns_topic
          send_resolved: false
          sigv4:
            region: us-east-1
          message: |
            alert_type: {{ .CommonLabels.alertname }}
            event_type: {{ .CommonLabels.event_type }}
However, the SNS topic doesn’t contain an access policy that would allow the workspace to publish alerts. Because the workspace doesn’t have permission to publish to the SNS topic, I expect that alerts won’t be sent. Now I’ll configure vended logs within the workspace to gain better visibility into any errors that the workspace is encountering with processing alerts.
As a first step, I create a new CloudWatch log group. I have called my log group /aws/vendedlogs/prometheus. It’s recommended that you create a log group that starts with /aws/vendedlogs/.
Once a CloudWatch log group has been created, navigate to the Amazon Managed Service for Prometheus workspace in the AWS Console. Select the Logs tab of the workspace. Select Manage logs. On the page that appears, change Log level to All and enter the name of the Log Group that you created previously. In my case, my log group name is called /aws/vendedlogs/prometheus. Select Save changes.
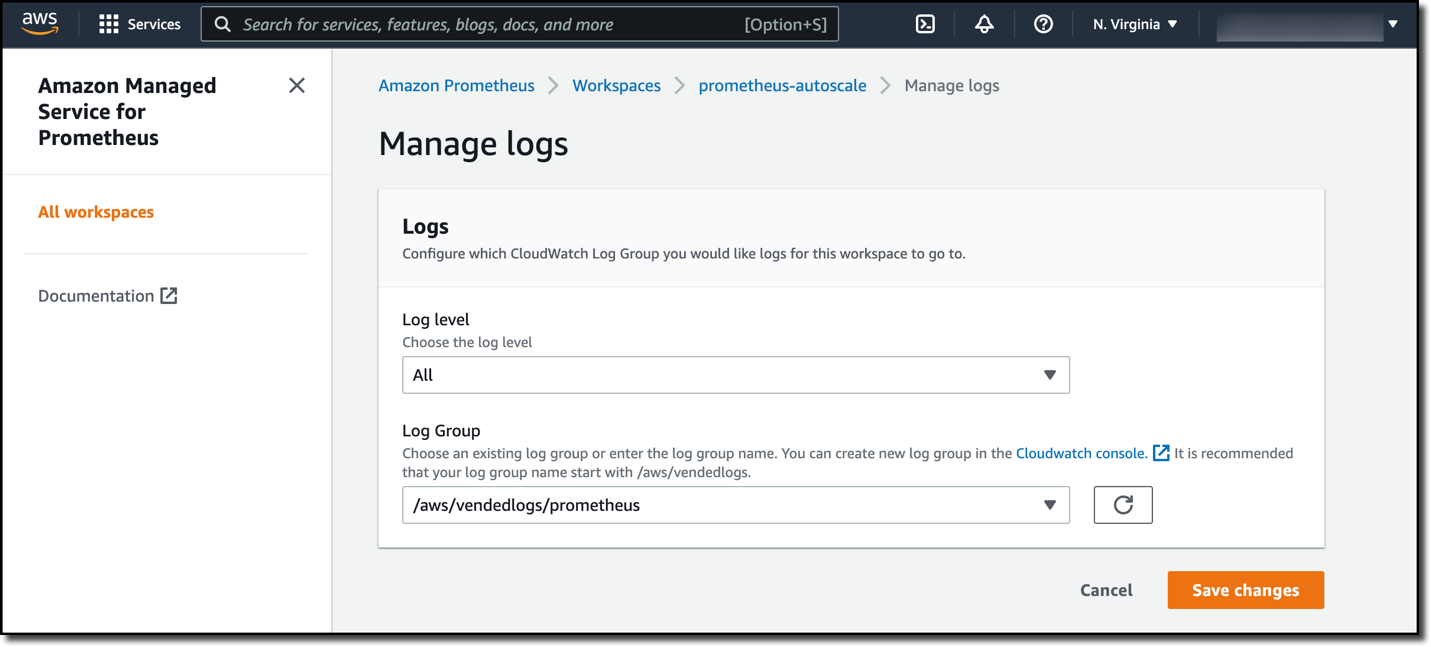
Figure 1. The manage logs entry box on the Amazon Managed Service for Prometheus workspace. The Log level field is set to All and the Log Group field is set to /aws/vendedlogs/prometheus.
Then, I apply load to my Amazon EKS workload to force the workspace rules to fire. After a few minutes, I begin seeing errors in the /aws/vendedlogs/prometheus CloudWatch log group.
{
    "workspaceId": "ws-000000000-0000-0000-0000-0000000000000",
    "message": {
        "log": "Notify for alerts failed, AMP is not authorized to perform: SNS:Publish on resource: arn:aws:sns:us-east-1:1234567890:my_sns_topic because no resource-based policy allows the SNS:Publish action",
        "level": "ERROR"
    },
    "component": "alertmanager"
}
From the error, it’s clear that alert manager has tried to publish the alert to the SNS topic, but it doesn’t have the right permissions to do so. Remember that alert manager doesn’t have permissions to publish to this SNS topic. Therefore, it’s unsurprising to see this error message.
I fix this issue by updating the access policy of the SNS topic so that the workspace has the sns:Publish and sns:GetTopicAttributes permissions on the SNS topic. After fixing the configuration, I begin seeing alerts being published to the SNS topic.
Cleanup
To prevent on-going charges for this workload, ensure you have deleted the Amazon Managed Service for Prometheus workspace and the EKS cluster that is being monitored.
Conclusion
In this post, I demonstrated the use of logs with Amazon Managed Service for Prometheus. I showed how you can quickly troubleshoot alert manager configuration issues, and I showed a specific example of how logs identified a permission error with alert manager in my workspace. Log data is sent to CloudWatch logs free of charge. However, you must pay for the storage of the log files. Standard vended log storage fees apply.
Further Reading
Get started today by configurating CloudWatch logs for your workspace. Logs can be enabled via the Console, AWS CLI, and CloudFormation.
Author: