AWS Cloud Operations & Migrations Blog
Enhance Operational Insight by Converting the Output of any AWS SDK Commands to Prometheus Metrics
Have you ever wished you had the output of an AWS Command to enrich your dashboards or alerts? The AWS control plane contains a rich set of information that can be operationally insightful!
Recently I encountered a customer running multiple Amazon Elastic Kubernetes Service (Amazon EKS) clusters in an IP constrained environment. When a subnet ran out of IPs, pods could no longer be run and the cluster became unhealthy! We needed a way to get the remaining IP Addresses for a subnet into Prometheus and Grafana.
The remaining IP Addresses in a subnet are available through the AWS DescribeSubnet Command. The challenge is to execute this command regularly, extract the information that we need, and make it available for Prometheus to ‘scrape’.
I created the aws-sdk-prom-metrics tool with an easy-to-understand configuration file to solve this. For this example, we’ll solve for DescribeSubnets, but the tool is flexible enough to be used for any AWS SDK Command!
Prerequisites
If you don’t already have an Amazon EKS Cluster running with Amazon Managed Service for Prometheus and Amazon Managed Grafana, then you can follow the steps outlined here:
- Create an AWS Cloud9 Environment following all of the steps in the Amazon EKS Workshop section ‘Start the Workshop…’ here.
- Create an Amazon EKS Cluster following all of the steps in the Amazon EKS Workshop section ‘Launch using eksctl’ here.
- Configure/install Amazon Managed Service for Prometheus on the cluster above by following the quickstart guide here.
- Configure Amazon Managed Grafana with the AMP environment above as a data-source. Follow the Quickstart guide here.
Clone the repository and install libraries
We’ll deploy a sample configuration that’s included with the project. This will execute the DescribeSubnets command every minute, and it will publish the results as Prometheus metrics.
Clone the repository from GitHub and install the required NPM libraries for it to function:
Build and push the image to AWS Elastic Container Registry
Create an Amazon Elastic Container Registry (Amazon ECR) repository using the AWS Command Line Interface (AWS CLI) and authenticate the local docker environment to push to it:
These commands will create our Docker image, tag it correctly, then push it to Amazon ECR.
Update the configuration file to include deployment details
We’ll use the AWS Cloud9 Editor to modify the configuration file that we’ve been using to include deployment configuration details.
In AWS Cloud9, select the folder icon, and navigate to find the subnet-remaining-ips.yaml file. Double-click the filename to edit the contents.
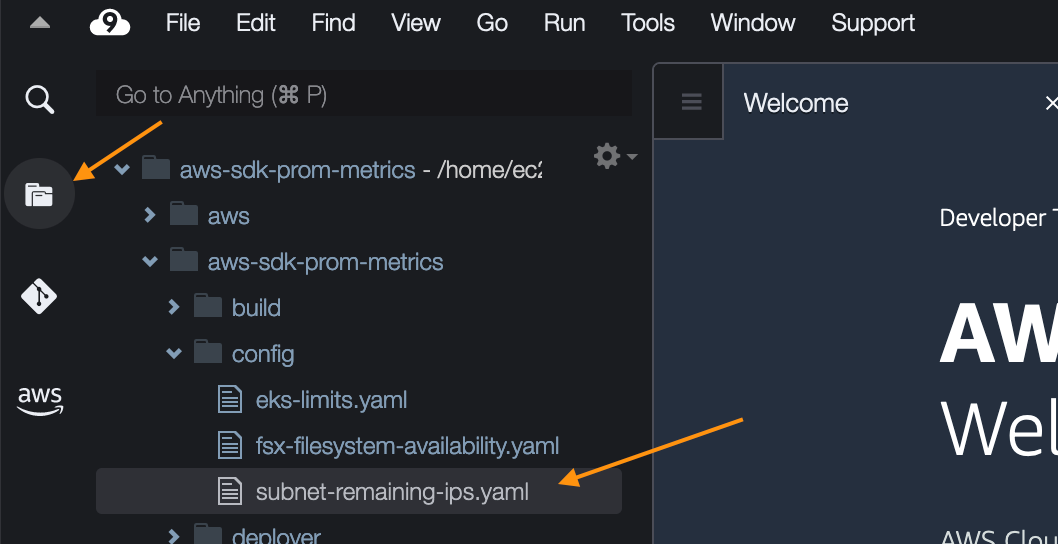
Figure 1. Open the configuration file in Cloud9 for editing
Remove the comments from the deploymentConfig section to match the following image:

Figure 2. Uncomment the deployment configuration in Cloud9
To find the correct value for oidcProvider, run the command:
This will output something similar to the following:
Use the identifier at the end and the ‘us-east-1’ region code to update the oidcProvider with a correct value.
To find the value for imageUri, we can use our repository that we saved earlier. Use the value from the following output for imageUri
Finally, we must place our AWS Account ID in the value for awsAccountId. The imageUri value will start with your AWS Account ID. Make sure that you surround the value in quotes so that YAML interprets it correctly!
When you’re finished, your configuration file will look something like this:
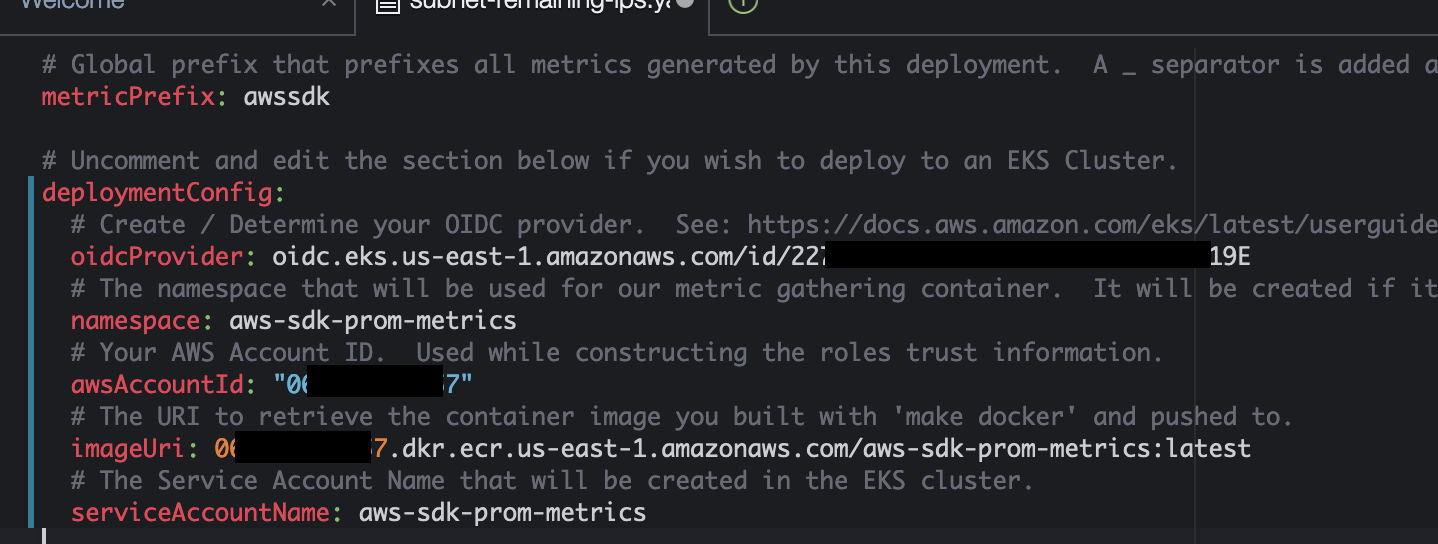
Figure 3. The edited configuration file in Cloud9
Deploy an IAM Role for Service Accounts (IRSA)
We use the Kubernetes SDK to create a deployment in the aws-sdk-prom-metrics namespace.
It may take a minute or two before everything is deployed. Let’s confirm using the kubectl command.
You should see output similar to this showing that everything is ready/running:
Visualize the data
Prometheus will automatically collect data from pods that contain an annotation of prometheus.io/scrape: true. Our deployed Pods contain this annotation, so no action is required to have them ‘scraped’ by Prometheus. We should have data flowing right away!
Sign in to Amazon Managed Grafana, and use the metric explorer. You should see a metric named awssdk_remaining_ips.
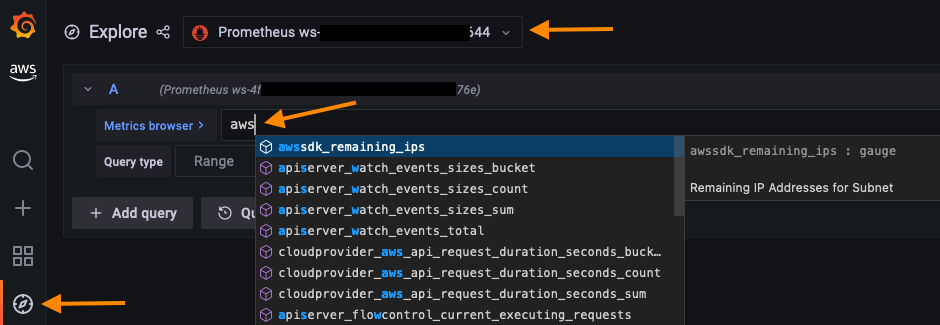
Figure 4. Explore the available metrics in Grafana
Use the Grafana Import Dashboard utility to import a dashboard. Copy and paste the contents from ~/environment/sample-dashboards/subnet-remaining-ips-dashboard.json into Grafana.
You can now see all of the remaining IP Addresses by Subnet Identifier, filtered by Availability Zone!
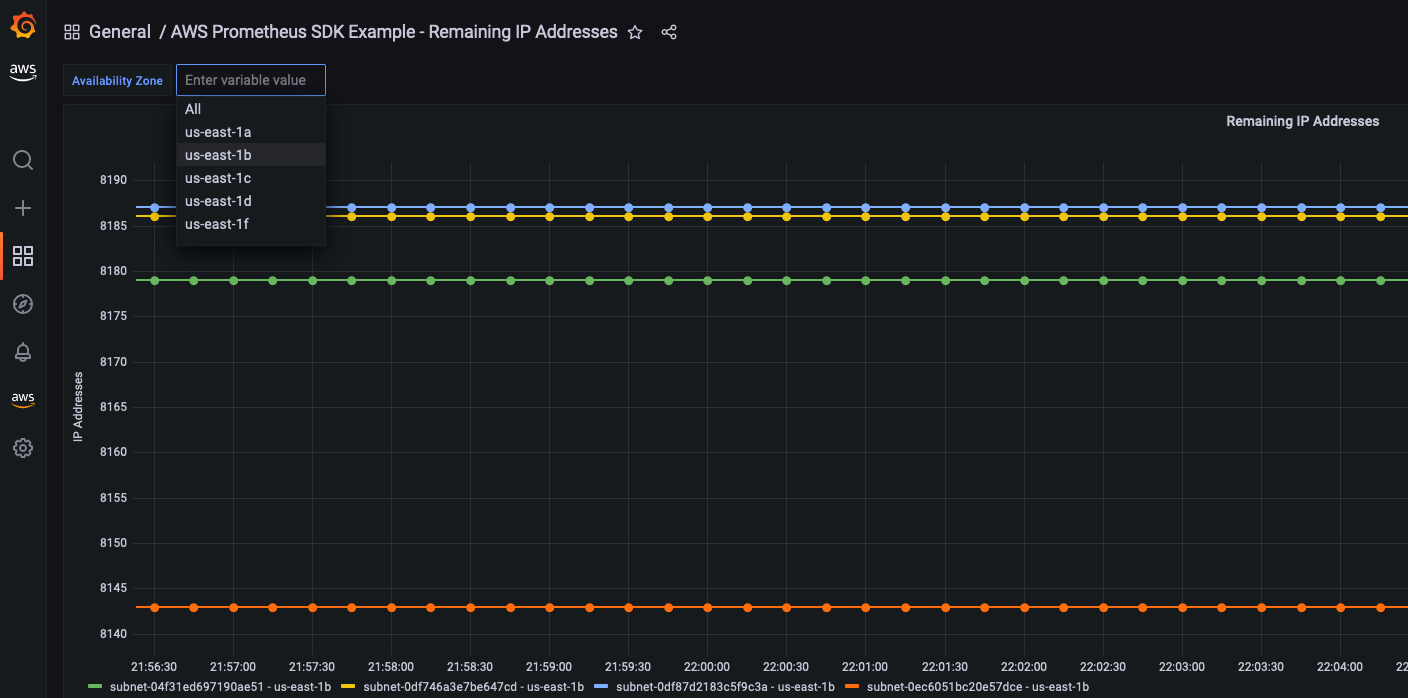
Figure 5. View the imported dashboard and see remaining IP addresses by subnet
Building your own configuration file and more information
I hope that you find this tool as useful as I have for gaining deeper insights into the operation of your AWS environments!
Note that the tool isn’t limited to DescribeSubnets, and has the capability to run any AWS SDK Command. Find more samples in the ‘config’ folder of the GitHub repository.
For more details, and a walkthrough of how to create your own configuration files, check out the README in the GitHub repository here.
About the author: