AWS Cloud Operations Blog
Announcing Prometheus Alertmanager rules in Amazon Managed Grafana
Today, we are announcing Amazon Managed Grafana’s new alerting feature that allows customers to gain visibility into their Prometheus Alertmanager alerts from their Grafana workspace. Customers can continue to use classic Grafana Alerting in their Amazon Managed Grafana workspaces if that experience better fits their needs. Customers using the Amazon Managed Service for Prometheus workspaces to collect Prometheus metrics utilize the fully managed Alert Manager and Ruler features in the service to configure alerting and recording rules. With this feature, they can visualize all their alert and recording rules configured in their Amazon Managed Service for Prometheus workspace.
Configuring Grafana workspace to view Prometheus alerts
Prometheus alerts view can be enabled from Amazon Managed Grafana console by simply checking the Grafana alerting checkbox in the Workspace configuration options tab. Once enabled, this will also migrate native Grafana alerts that were previously created in Grafana dashboards into a new Alerting page in the Grafana workspace.
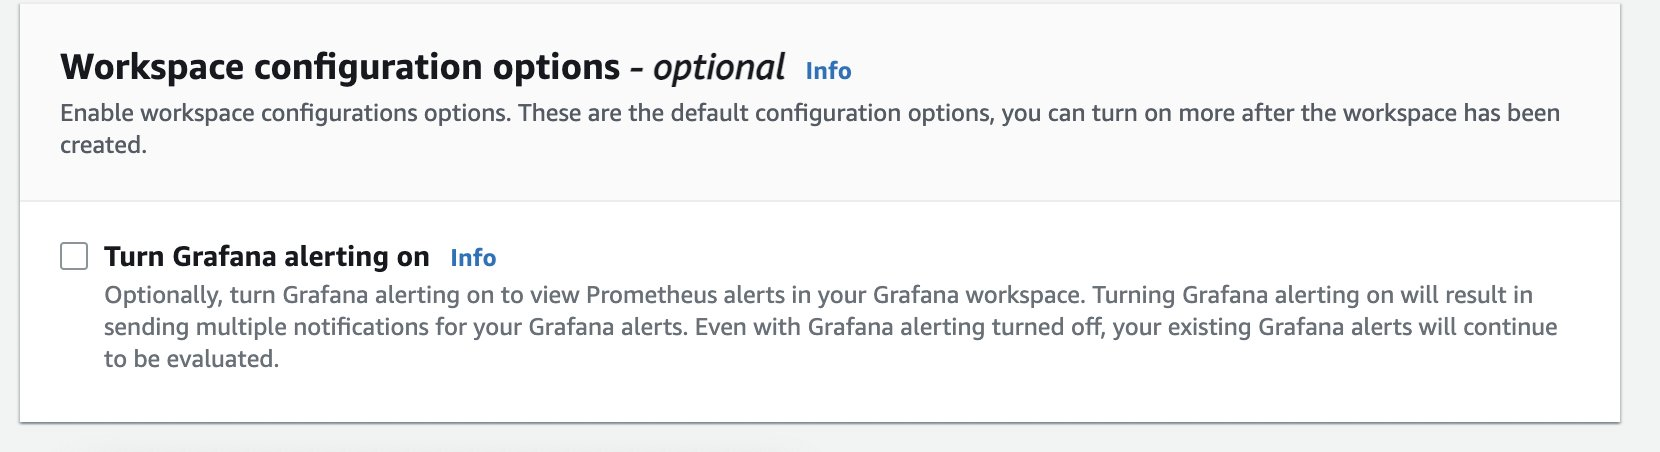
Figure 1. Enabling Grafana alerting on the AWS console.
Visualizing Alerts from Amazon Managed Service for Prometheus
It is presumed that you already have created an Amazon Managed Service for Prometheus workspace, ingested metrics into it and also have alert and/or recording rules configured.
You also need to have an Amazon Managed Grafana workspace created and have a datasource created that connects to an Amazon Managed Service for Prometheus workspace.
The following IAM permissions are required to be added to the IAM Policy, associated with the IAM Role that is associated with the Amazon Managed Grafana workspace. If you already have a workspace created, ensure the following permissions are present.
Steps to create Alert Manager data source
- Once you have the basic requirements met, login to your Amazon Managed Grafana workspace and create a new Alert Manager data-source by going to the Data sources page under Configuration.
- Select Add data source button, type in alert in the search text and select Alertmanager from the results
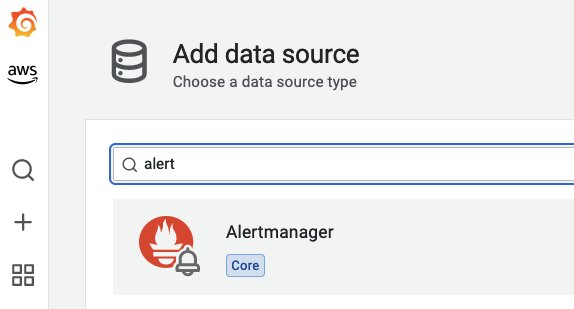
Figure 2. Alert Manager data source.
- Next, do the following in the Alertmanager datasource
- Select Prometheus in the Implementation dropdown
- Copy and paste the target Amazon Managed Service for Prometheus workspace URL and add /alertmanager to the end
- Select SigV4 auth under Auth section. This will allow the Grafana workspace to authenticate with the data source using the SigV4 protocol.
- Select the AWS Region of your Prometheus workspace for Default Region under SigV4 Auth Details section
- Select Save & test. If you see a message saying Health check passed, your data source is working fine.
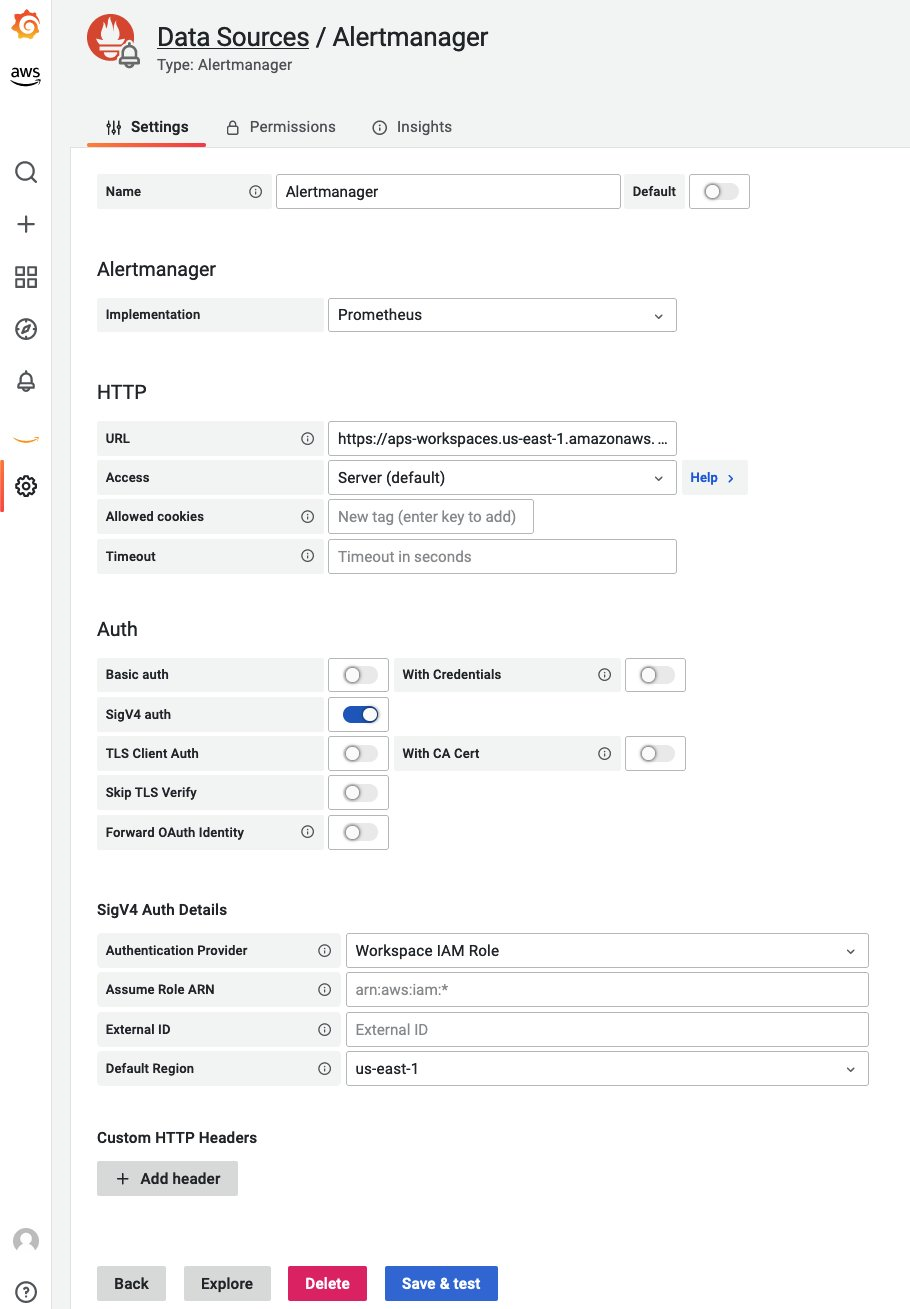
Figure 3. Alert manager data source connection settings.
Connect Alert Manager data source to Prometheus data source
- Open your Amazon Managed Service for Prometheus data source and enable Manage alerts via Alerting UI toggle switch
- Select the newly created Alertmanager datasource for the Alertmanager data source drop down
- Select Save & test to ensure the data source is working properly
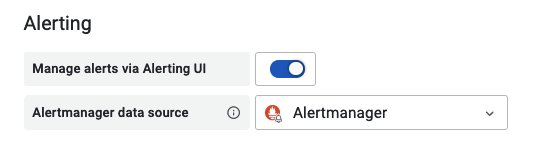
Figure 4. Selecting Alertmanager data source for Prometheus data source.
Using the new alerting interface
Navigate to the Alerts interface by clicking on the bell icon on the left navigation bar.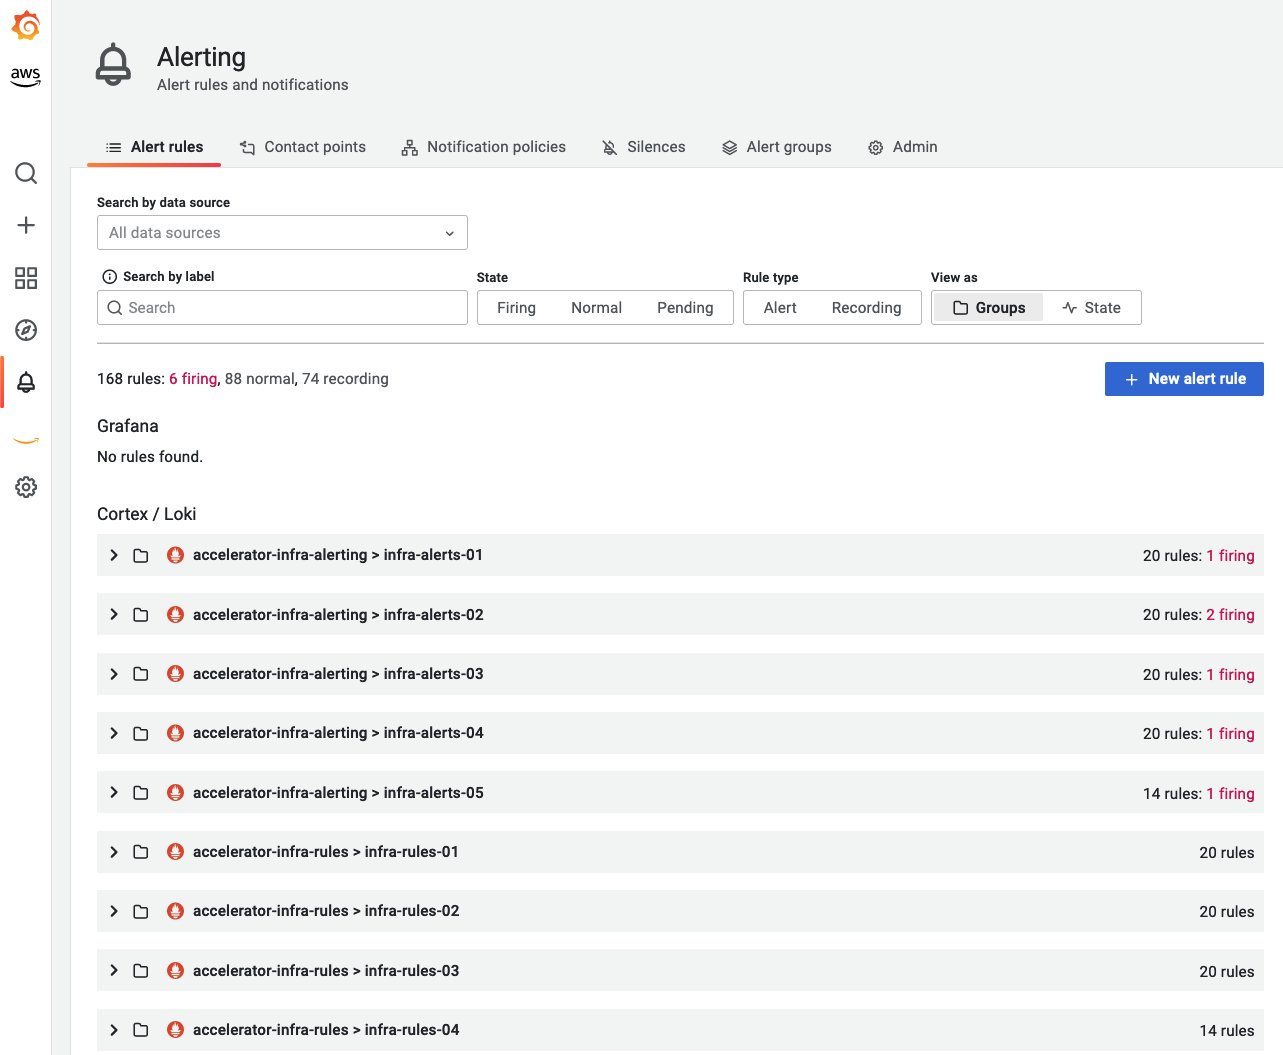
Figure 5. List of Alerts from Amazon Managed Service for Prometheus data source.
Viewing and Filtering alerts, and recording rules
You can filter and group alerts based on a couple of options. As you can see in the GIF below, you can view alerts based on alert groups or to get an easier view on alerts based on their status, you can have them grouped by their alert status by selecting the State option under View as section. You can filter the user interface to show either the alerting rules or the recording rules by selecting the appropriate option under Rule type section. For more advanced use cases when you need precise search scenarios, you can also use the
Search by label feature. This feature allows you to search for alerts and recording rules based on the alert labels. For example, you could search for an alert called
KubeProxyDown by simply using the following query.
For more advanced use cases when you need precise search scenarios, you can also use the
Search by label feature. This feature allows you to search for alerts and recording rules based on the alert labels. For example, you could search for an alert called
KubeProxyDown by simply using the following query.
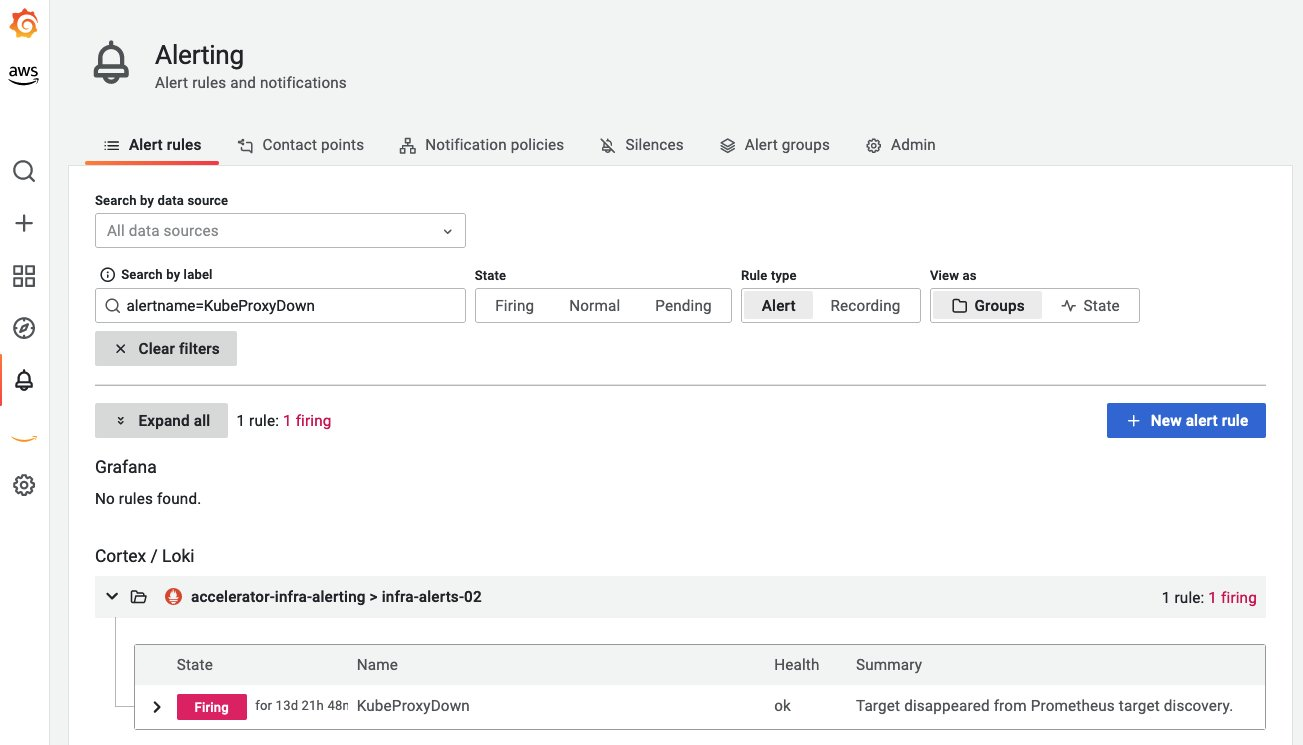
Figure 7. Filtering alerts using labels
Silencing Alarms
Alarm silencing is a feature that allows you to pause notifications from a firing alarm for a certain period of time. You can Silence a firing alarm by simply clicking the Silence button in the alert details screen.
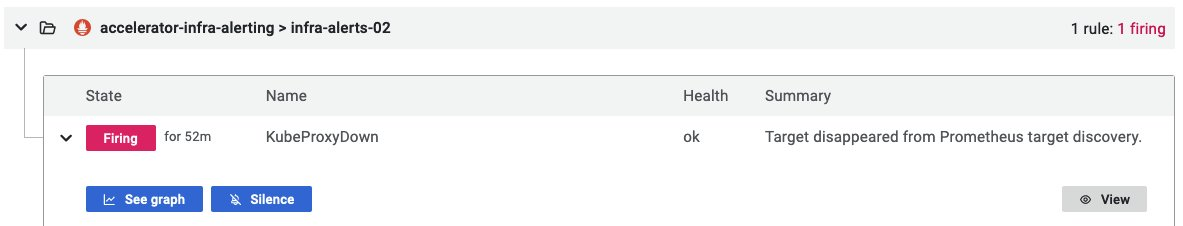
Figure 8. Silencing alarms
Clicking on Silence will take you to the Silences screen where you can select the duration, edit the Silence details by adding or removing label conditions and click on Submit button.
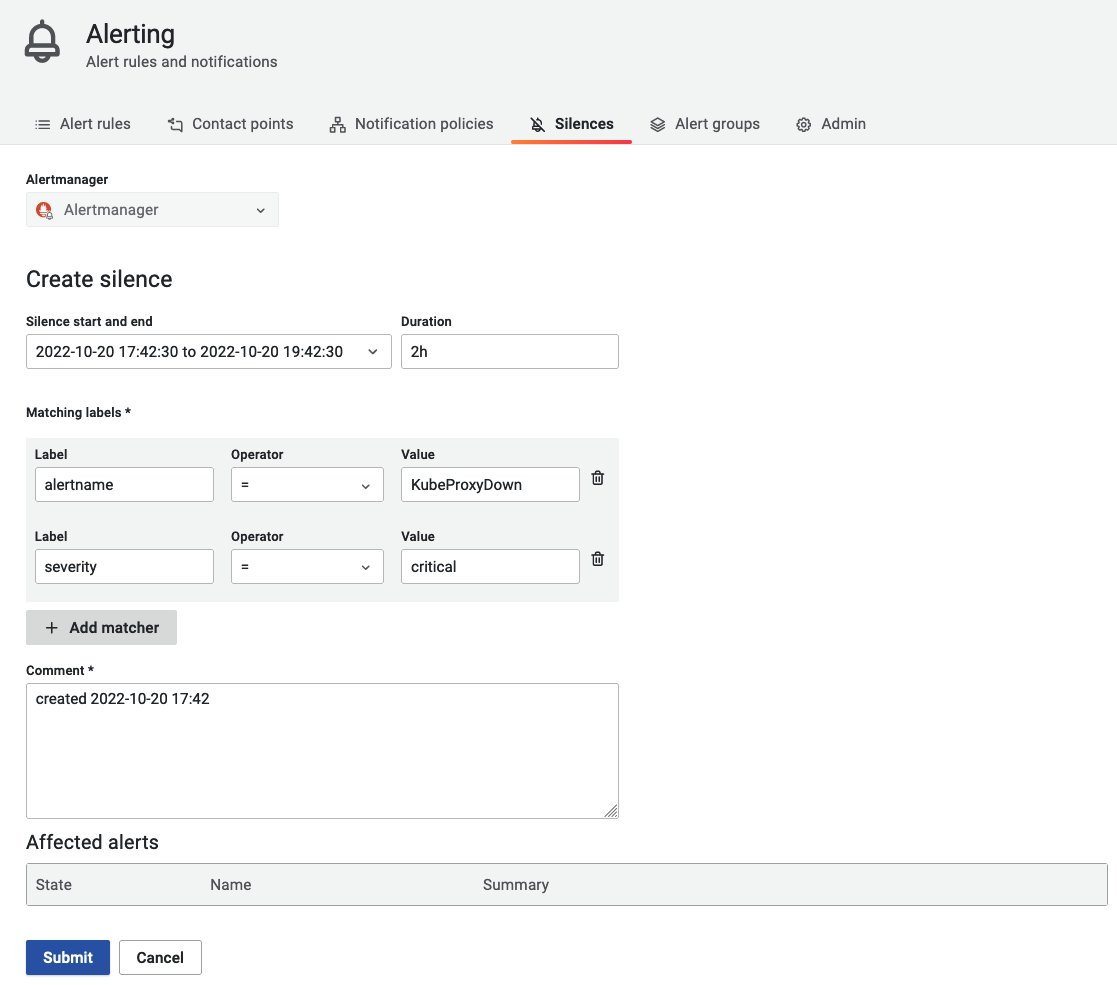
Figure 9. Creating a new alert silence.
Conclusion
In this blog post, we showed you how you can use the newly launched Amazon Managed Grafana’s alerting feature that allows it to easily visualize Amazon Managed Service for Prometheus Alert manager alerts. We encourage customers to provide inputs through GitHub as we are actively collecting use cases and feedback from the community on how we need to develop and expand this feature. Learn more about this feature in our documentation.
Other useful resources on Amazon Managed Grafana:
- https://aws.amazon.com/blogs/mt/fine-grained-access-control-in-amazon-managed-grafana-using-grafana-teams/
- https://aws.amazon.com/blogs/opensource/setting-up-amazon-managed-grafana-cross-account-data-source-using-customer-managed-iam-roles/
To get a hands-on experience on this feature, go to the One Observability workshop.
About the authors: