AWS Cloud Operations Blog
Monitoring Amazon RDS and Amazon Aurora using Amazon Managed Grafana
Organizations running critical applications on AWS using fully managed database services such as Amazon Relational Database Service (Amazon RDS) and Amazon Aurora rely on robust monitoring to ensure that their databases are performant, and cause no service disruptions to their customers.
Amazon Managed Grafana is a fully managed and secure data visualization service that you can use to instantly query, correlate, and visualize operational metrics, logs, and traces from multiple sources. Amazon Managed Grafana is integrated with AWS data sources such as Amazon CloudWatch, Amazon OpenSearch Service, Amazon Athena and Amazon Managed Service for Prometheus (AMP), for collecting operational data. Amazon Managed Grafana also provides plug-ins to popular open-source databases, third-party monitoring tools, as well as other cloud services. With Amazon Managed Grafana, you can easily visualize information from multiple AWS services, AWS accounts, and on-premises in a single Grafana dashboard. Amazon Managed Grafana allows you to configure user access through AWS IAM Identity Center or other SAML based Identity Providers (IdP).
In this blog, we will walk through how you can monitor your Amazon RDS and Amazon Aurora database clusters including Performance insight metrics using Amazon Managed Grafana.
Solution overview
On a high level, we will gather important metrics such as CPU utilization, memory usage, and database connections from RDS and Aurora, and store them in Amazon CloudWatch. Additionally, we may also deploy a custom Lambda function to collect RDS Performance Insight metrics and send them to CloudWatch. Finally, we will create an Amazon Managed Grafana workspace and connect it to CloudWatch as a data source, allowing us to easily visualize and track the health and potential performance issues of our RDS/Aurora databases.
The following diagram shows solution architecture:
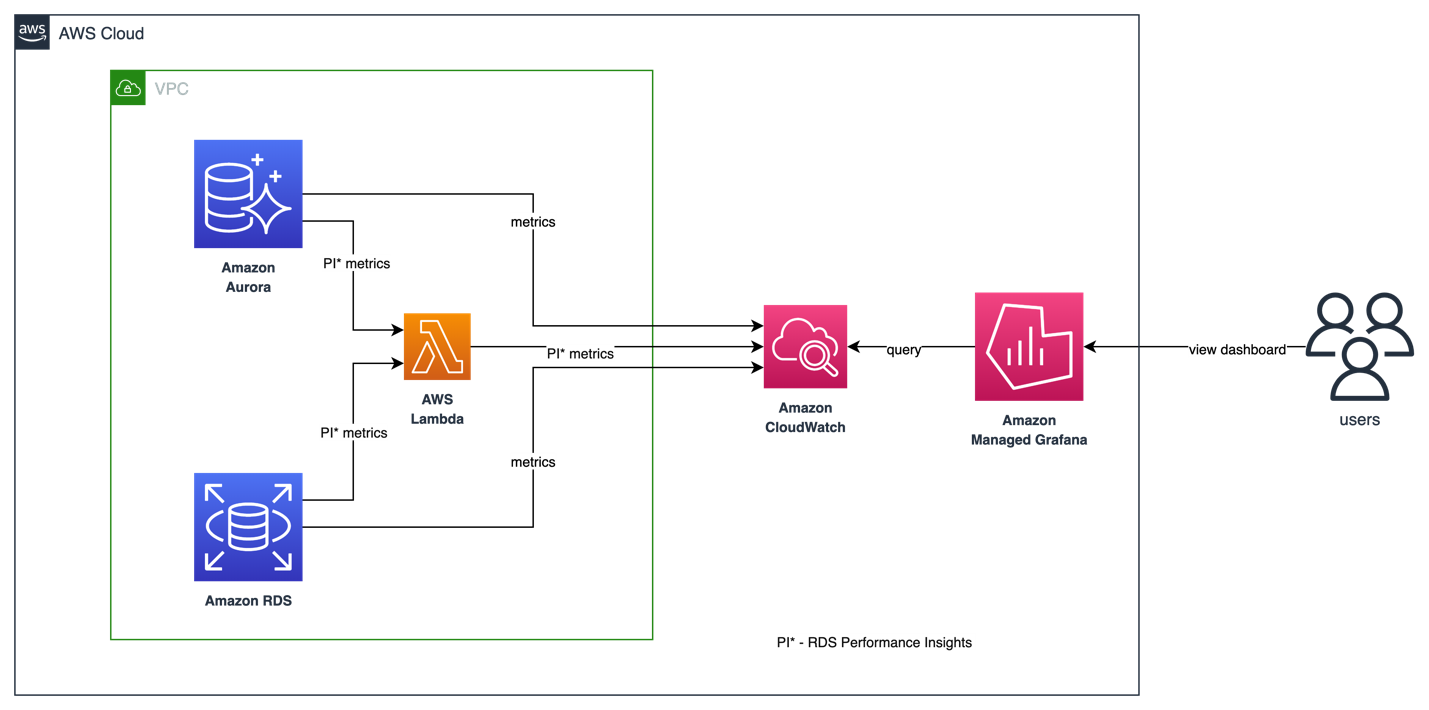
Figure 1. Architecture of our solution to monitor Amazon RDS and Amazon Aurora using Amazon Managed Grafana
Solution Walkthrough
Prerequisites
You will need the following to complete the steps in this post:
- Amazon RDS for PostgreSQL or Amazon Aurora PostgreSQL-Compatible Edition cluster. If you do not already have one running in your AWS environment, use either Amazon RDS for PostgreSQL on AWS or Modular Architecture for Amazon Aurora PostgreSQL quick start template. You have options to either deploy into newer VPC or an existing VPC.
Viewing Amazon RDS or Aurora Metrics in Amazon CloudWatch
Metrics in Amazon CloudWatch is grouped by the service namespace, and then by the various dimension combinations within each namespace. The AWS/RDS namespace includes the metrics that apply to database entities running on Amazon RDS and Amazon Aurora. To see all the RDS and Aurora Metrics available in Amazon CloudWatch, see Monitoring Amazon RDS metrics with Amazon CloudWatch and Amazon CloudWatch metrics for Amazon Aurora.
Let’s take a look at metrics available for an Aurora PostgreSQL-Compatible cluster and database instances in Amazon CloudWatch.
- Navigate to Amazon CloudWatch console for view Amazon Aurora metrics. The link opens in the Oregon (us-west-2) Region. To switch regions, pick a region of your choice from the top navigation bar.
- Choose the RDS metric namespace. The page displays the Amazon RDS dimensions. For descriptions of these dimensions, see Amazon CloudWatch dimensions for Amazon RDS.
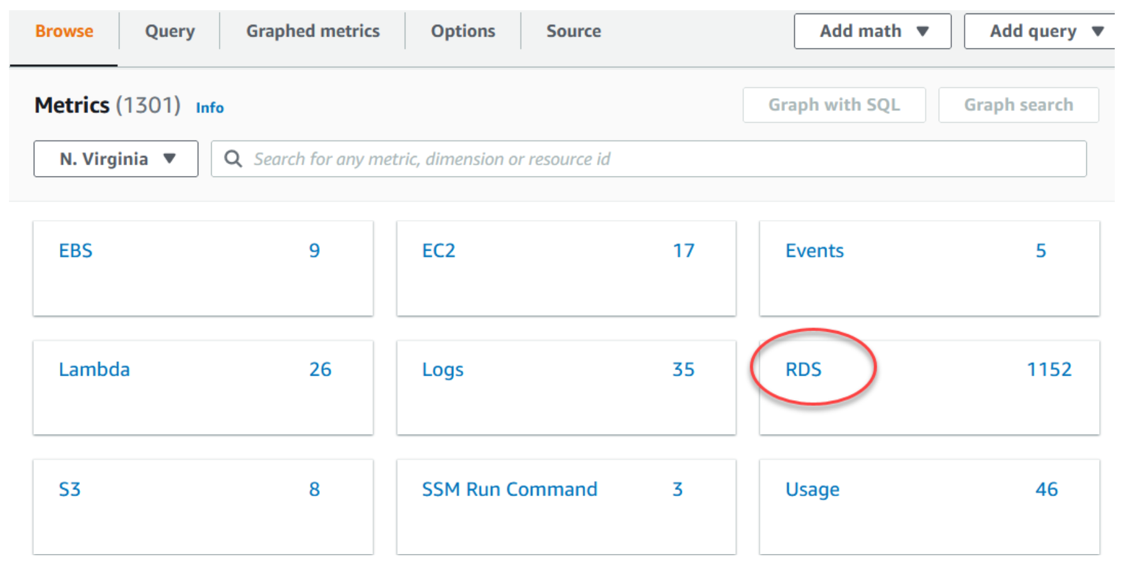
Figure 2. Display showing the Amazon RDS dimensions
- Choose a metric dimension, for example by
DBClusterIdentifier. Then search for the name of the cluster and ensure that you are able to see its metrics.
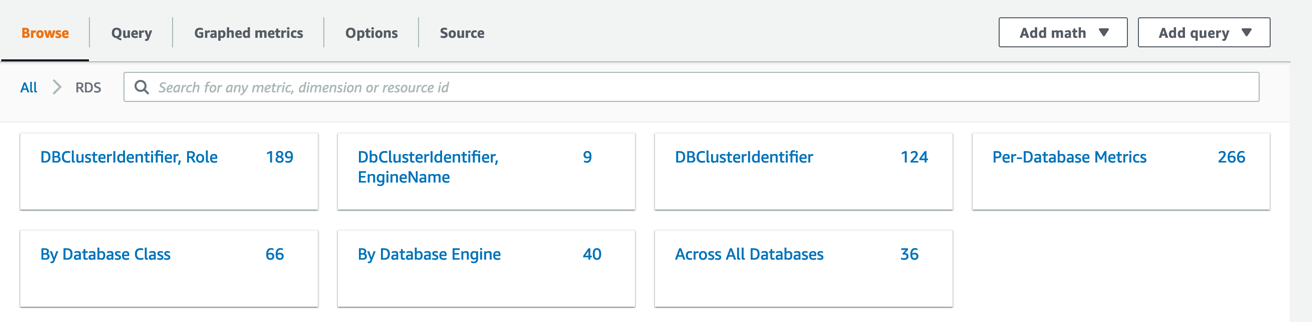
Figure 3. Choosing a metric dimension
Create Amazon Managed Grafana workspace with CloudWatch as a data source
In this section, we will setup Amazon Managed Grafana to monitor RDS database instances and Aurora database clusters. Create an Amazon Managed Grafana workspace using the instructions in Create a workspace. Then, configure CloudWatch as a data source. Go to ‘settings’ and choose ‘Save and test’ to ensure data source works as expected.
Query database metrics and create Amazon Managed Grafana dashboard
Amazon RDS provides various metrics and insights for monitoring, such as CloudWatch metrics, Enhance monitoring & Performance Insights. By integrating these metrics into Grafana dashboard, you can visualize all these metrics for all your RDS instances in a single place. To view and query these metrics through CloudWatch data source, you can use Explore or import default Amazon RDS dashboard.
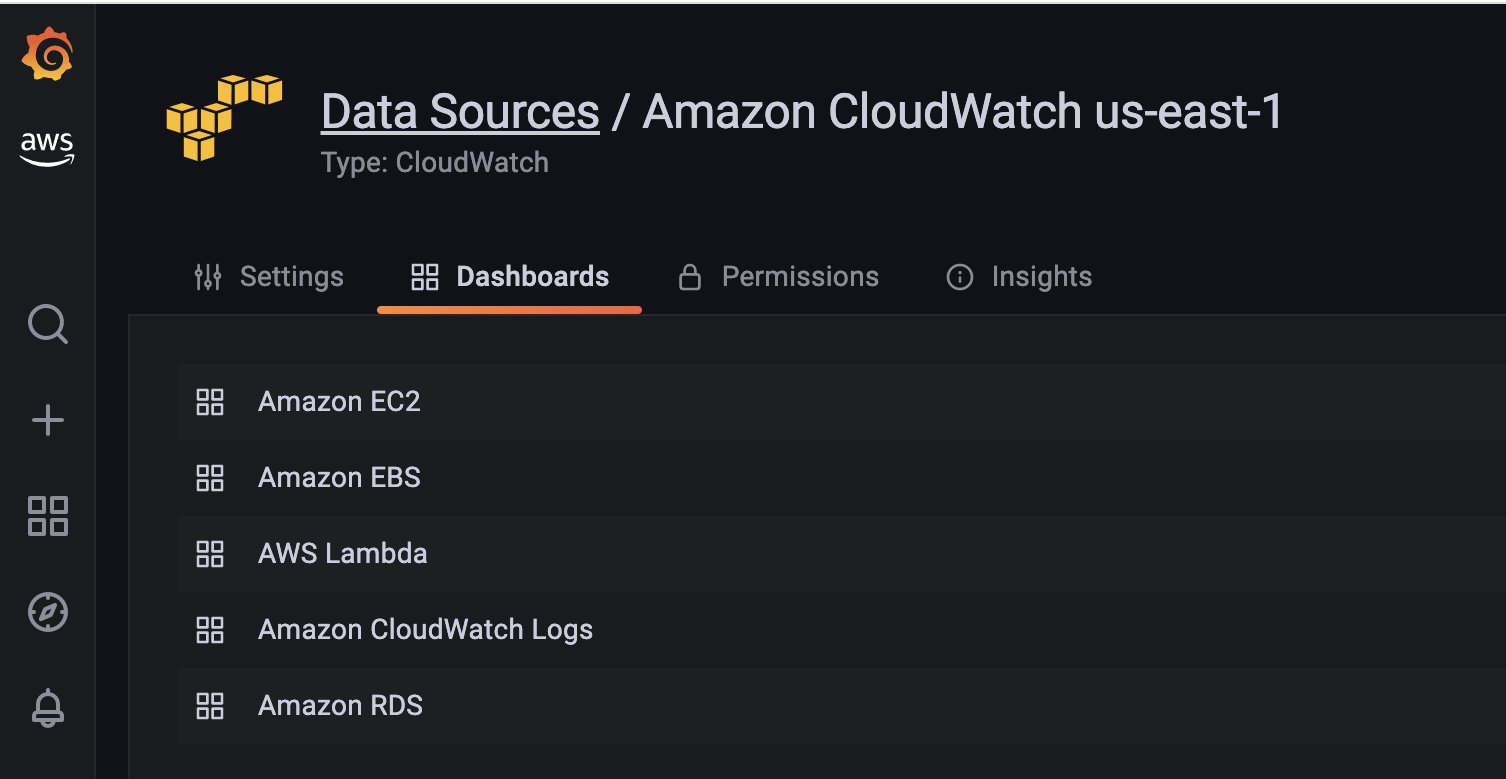
Figure 4. Dashboards through CloudWatch data source
Amazon RDS Dashboard
You can import the curated Grafana dashboard for Amazon RDS through aws > Data Sources > Dashboards.
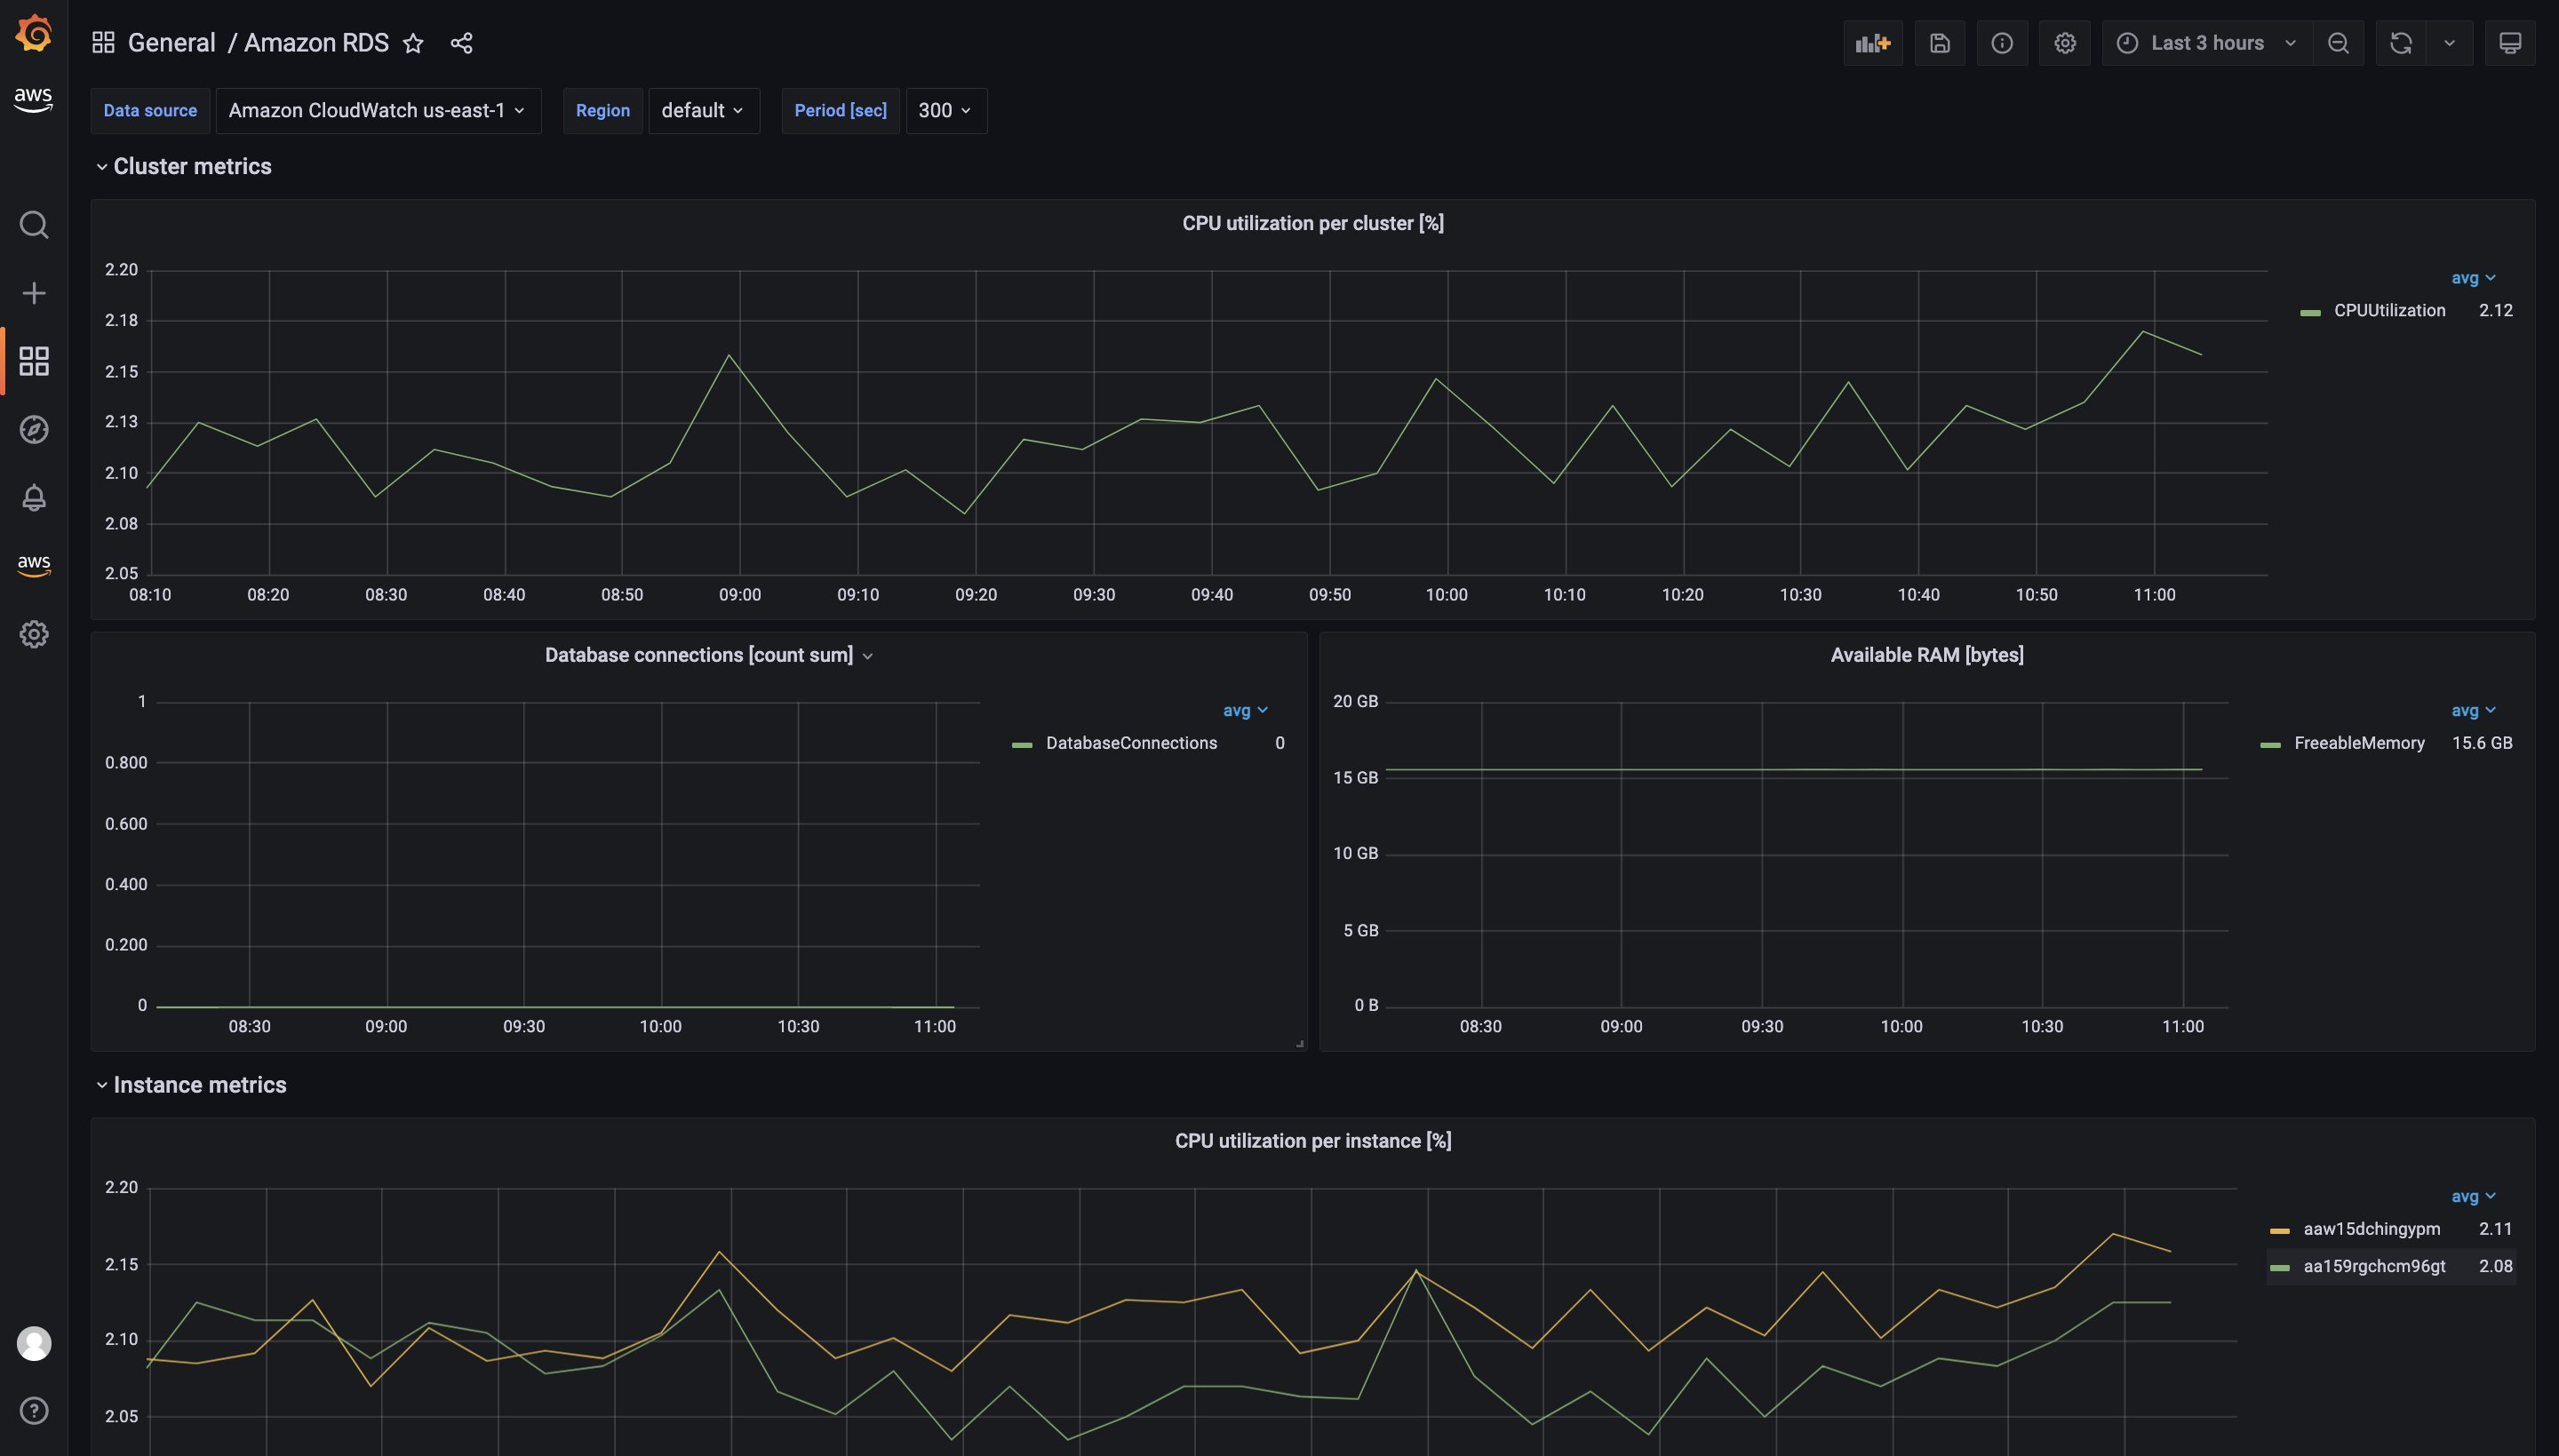
Figure 5. Grafana dashboard for Amazon RDS
Performance Insights metrics
Performance Insights (PI) expands on existing Amazon RDS monitoring features to help you analyze your database performance. With the Performance Insights dashboard, you can visualize the database load on your Amazon RDS or Aurora cluster load and filter the load by waits, SQL statements, hosts, or users. To turn on and off performance Insights for your RDS or Aurora cluster, see Turning Performance Insights on and off.
Customers have told us they would like to see Performance insights metrics in Amazon Managed Grafana to have a single pane of glass for their DBAs and DevOps teams. As of now, only basic RDS Performance Insights metrics are available in CloudWatch which is not sufficient to analyze database performance and identify bottlenecks in your database.
Customers can use custom lambda functions to collect all the RDS Performance insights metrics and publish them in a custom CloudWatch metrics namespace. Once you have these metrics available in Amazon CloudWatch, you can visualize them in Amazon Managed Grafana.
To deploy the custom lambda function to gather RDS Performance Insights metrics, clone the following GitHub repository and run the install.sh script.
This script uses AWS CloudFormation to deploy a custom lambda function and an IAM role. Lambda function auto triggers every 10 mins to invoke RDS Performance Insights API and publish custom metrics to /AuroraMonitoringGrafana/PerformanceInsights custom namespace in Amazon CloudWatch.
To visualize these metrics in Amazon Managed Grafana, create a new CloudWatch data source as described at Use AWS data source configuration to add CloudWatch as a data source. Update namespace of custom metric in the CloudWatch data source to /AuroraMonitoringGrafana/PerformanceInsightsMetrics and Save/Test the data source. You can optionally customize the name of the custom CloudWatch namespace using Lambda environment variables.
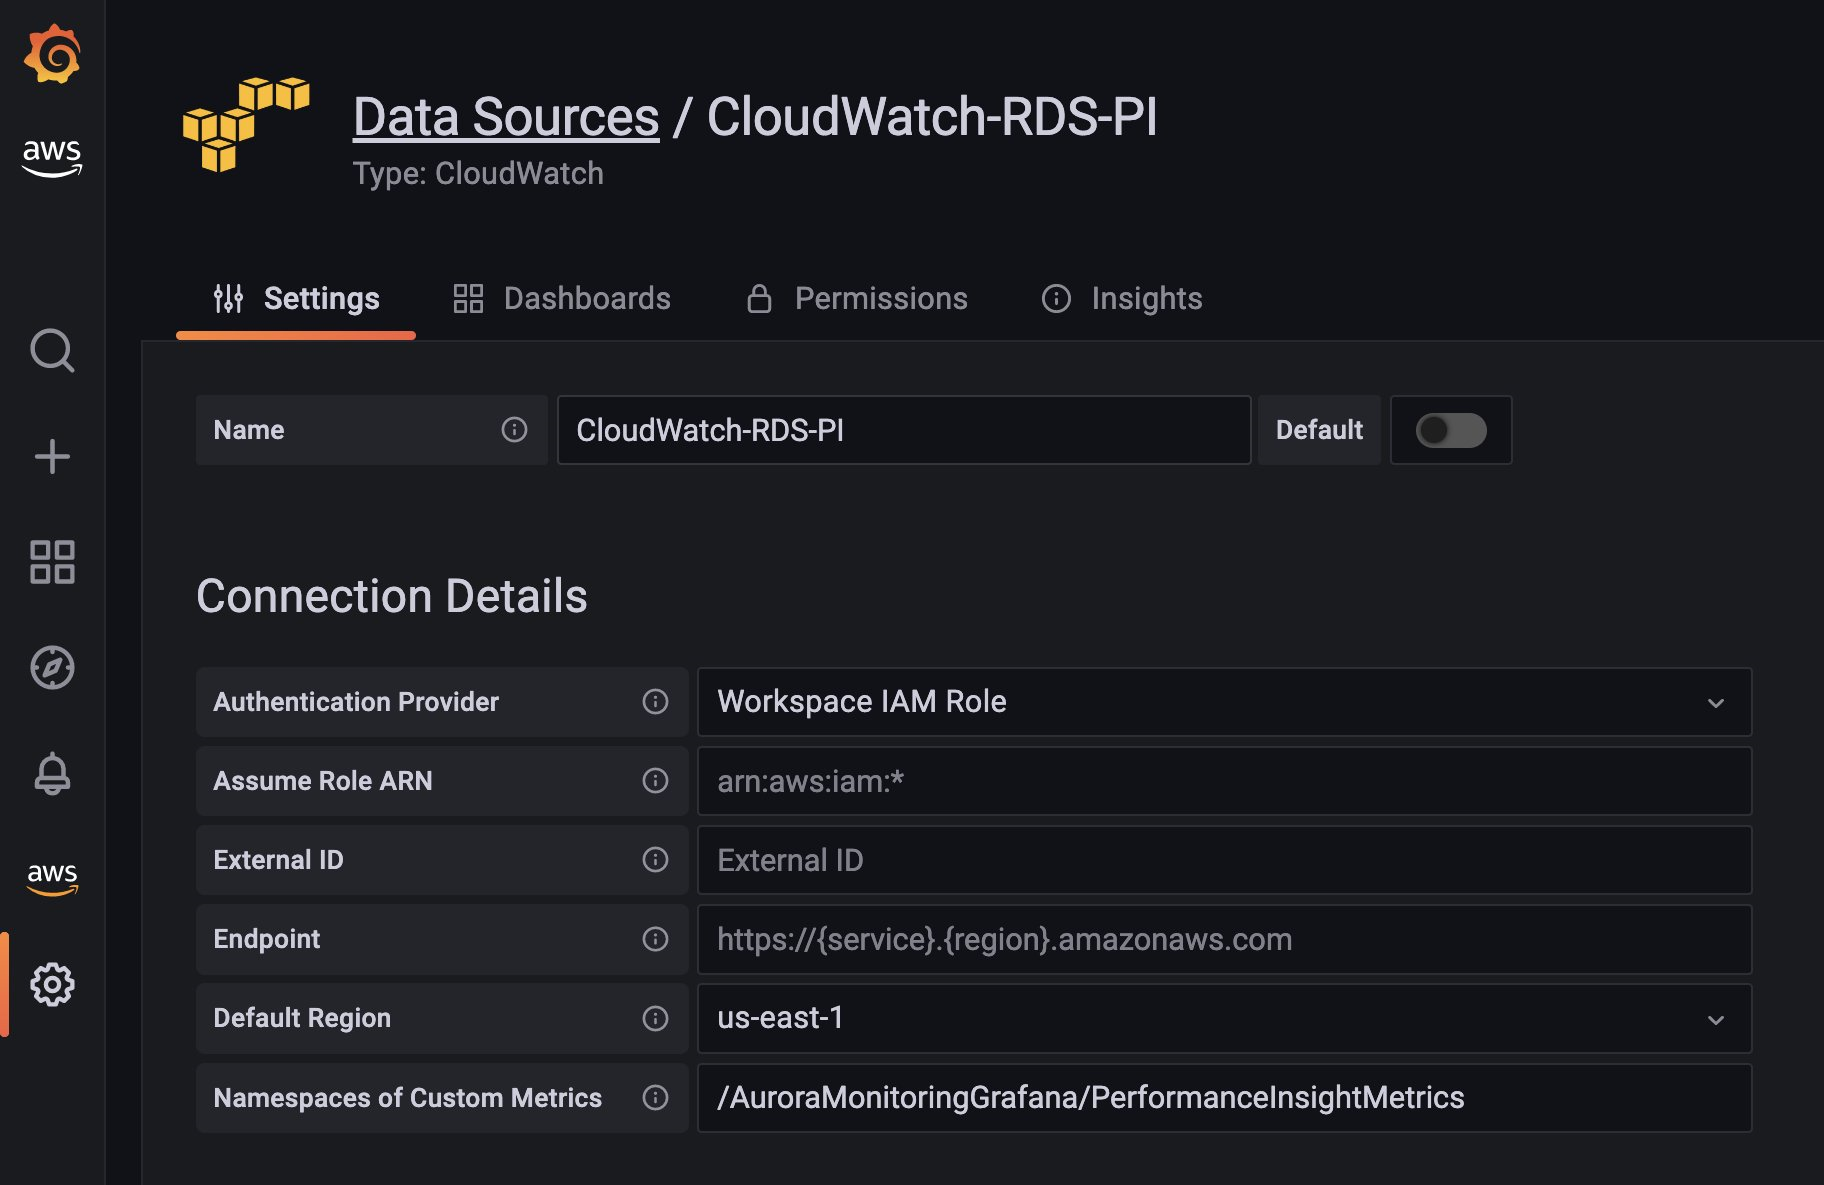
Figure 6. Dashboards through CloudWatch data source
To visualize metrics from the RDS Performance Insights, import the Grafana dashboard for Performance Insights using dashboard.json from above GitHub repository. Go to the plus sign on the left navigation bar, and select Import and select Upload JSON file option. You will see dashboard similar to below:
Database Load
Database load (DBLoad) characterizes how an application is spending time in the database. It is measured in units of average active sessions (AAS). An active session is a connection (session) that has submitted work to the database engine and is waiting for a response from it. DBLoad chart shows the recent history of database load in units of average active sessions (AAS).
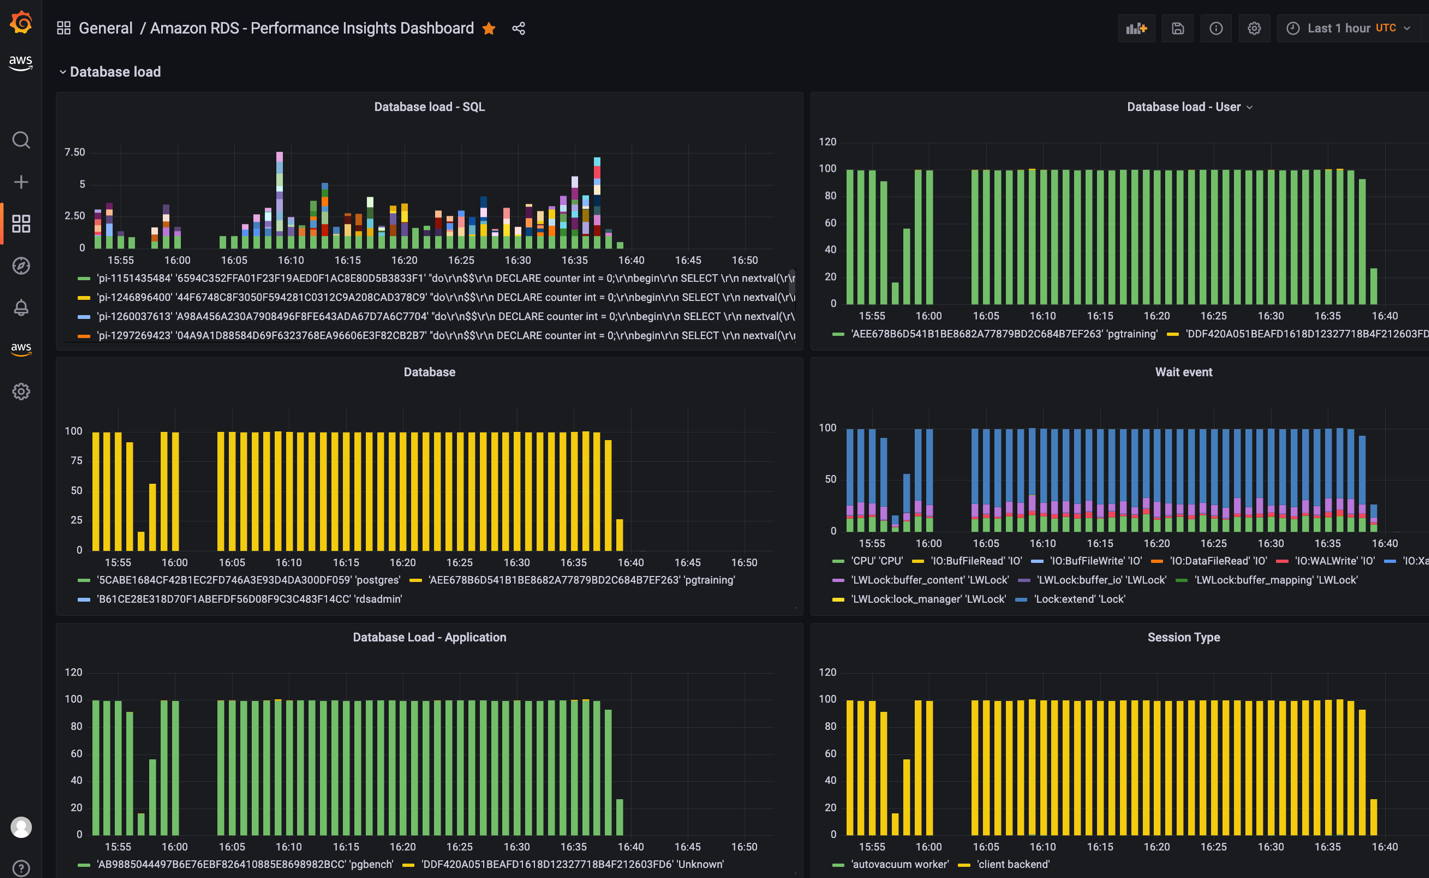
Figure 7. Grafana dashboard with Database load (DBLoad)
Top Load Events
The top load activity chart shows what is contributing to database load for the time interval on the load chart.
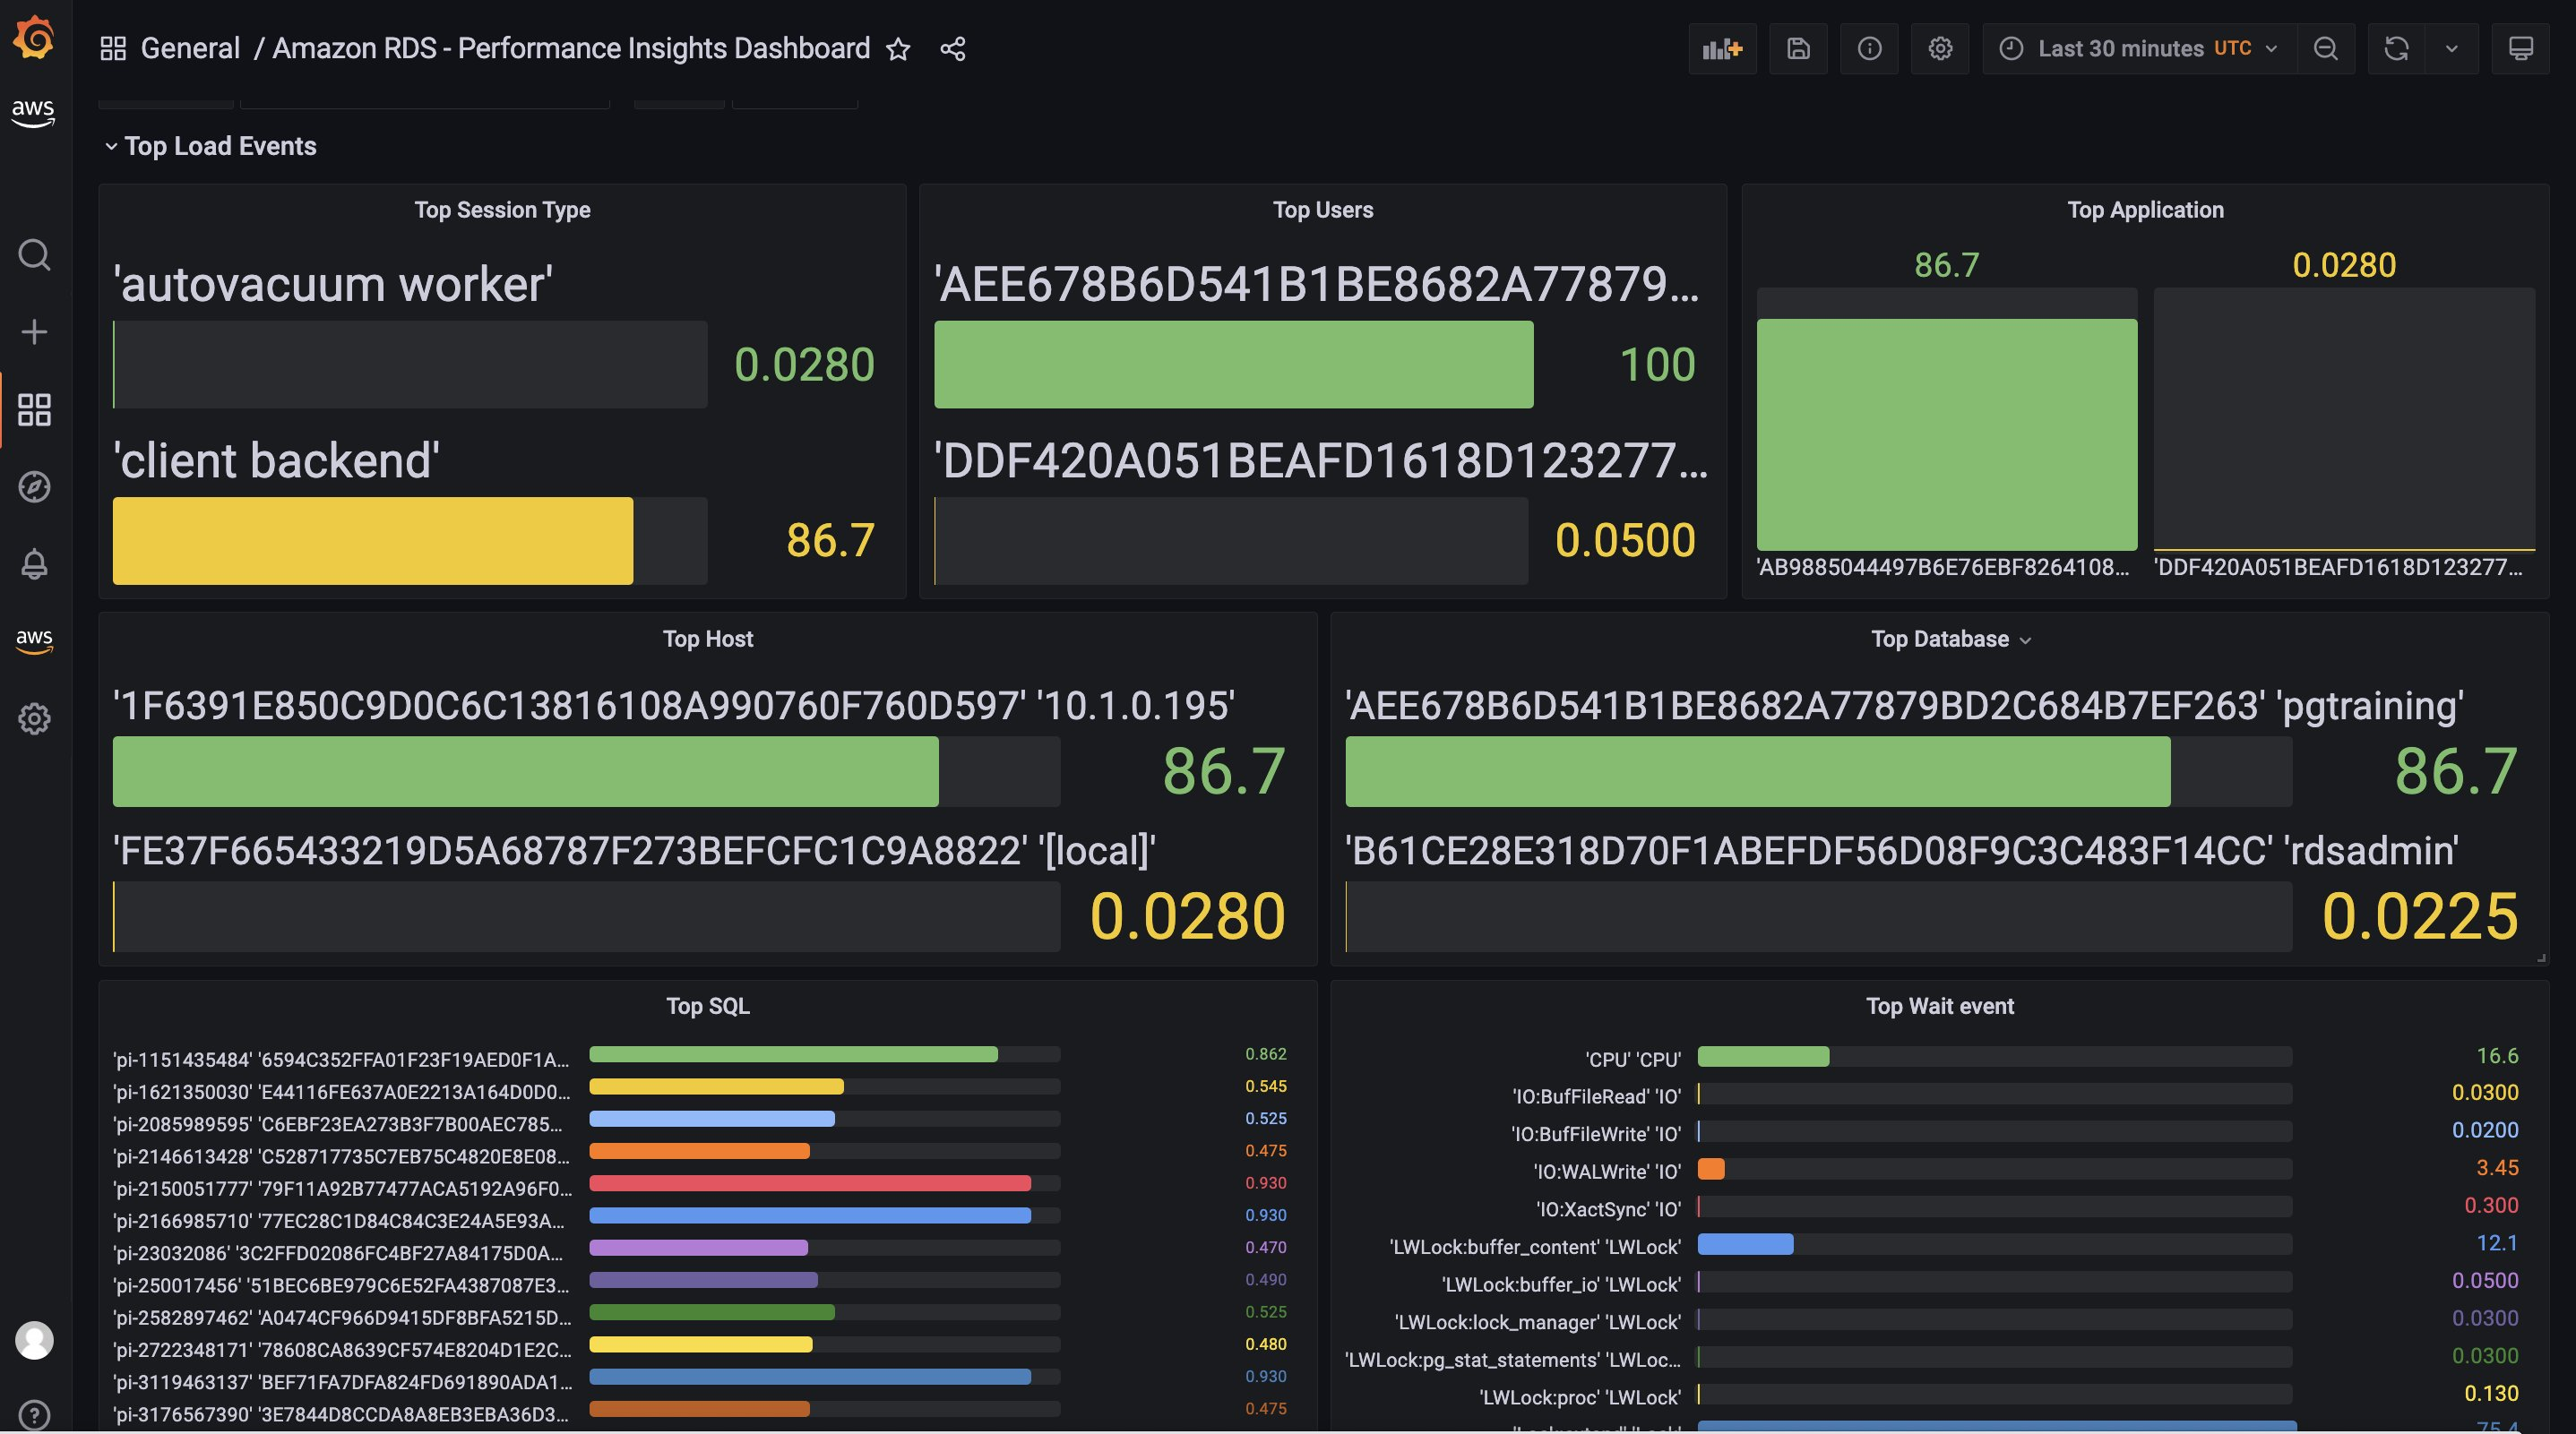
Figure 8. Grafana dashboard with top load activity chart
Alerting in Amazon Managed Grafana
Configuring alerts allows you to identify and notify on problems in your system or database moments after they occur. By quickly identifying unintended changes in your system and notifying using alerts, you can take actions to minimize disruptions to your services. Amazon Managed Grafana supports multiple notification channels such as SNS, Slack, PagerDuty etc. to which you can send alerts notifications. Alerts page will show you more information on how to set up alerts in Amazon Managed Grafana. Also check our Blog on Monitor Istio on EKS using Amazon Managed Prometheus and Amazon Managed Grafana which will show you on triggering Amazon Managed Grafana alerts to PagerDuty.
Cleanup
You will continue to incur cost until deleting the infrastructure that you created for this post. Use the following steps to clean up the created AWS resources for this demonstration.
Remove Grafana Workspace
- Open the Amazon Managed Grafana console at https://console.aws.amazon.com/grafana/. In the navigation pane, choose the menu and choose All workspaces.
- Choose the name of the workspace that you want to delete and select
Delete. - To confirm the deletion, enter the name of the workspace and choose
Delete. - Remove Amazon Aurora Cluster
Navigate to AWS CloudFormation console to delete the created CloudFormation stack for the creation of Amazon Aurora PostgreSQL using AWS Quick Starts. Alternatively, follow the instructions in Deleting an Aurora DB cluster to delete Amazon Aurora DB cluster manually.
Conclusion
In this post, we walked you through monitoring and visualizing all your database metrics on Amazon Aurora/RDS using Amazon Managed Grafana. Additionally, we reviewed how DevOps and Database administrators can retrieve and visualize Performance Insights metrics to get better insights into their database workloads to identify performance bottlenecks. To see the demo, check out this video Monitor Amazon RDS and Aurora Databases on Amazon Managed Grafana. We recommend you to also consider Amazon DevOps Guru for RDS, which consumes Performance Insights metrics, analyzes them using Machine Learning (ML) to provide database-specific analyses of performance issues, and recommends corrective actions. You can get hands-on experience with the AWS observability services at One Observability Workshop.
About the authors: