AWS & OpenTelemetry strikes back: Tail-based Sampling
Find out what tail sampling is and how to set up OpenTelemetry collectors to work with it in gateway mode at scale.

This article won’t mention OpenTelemetry basics and it is continuation of previous article about setting up OpenTelemetry on AWS that you can find here: https://medium.com/@sodkiewiczm/aws-opentelemetry-e553de8cadf
Why would I need tail-based sampling?
Before we look at what tail-based sampling is, let’s consider what problem it solves and what other sampling strategies we have at our disposal.
Head (stateless) sampling
The most popular head sampling strategy is probabilistic sampling, which is a dreadfully simple sampling strategy. It decides whether or not to sample your traces by “rolling the dice”. So the way you define your sampling is: “I want to sample x% of all traces”. We love it for its simplicity and this is exactly the sampling strategy we used in the previous article.
At some point you realise that systems overview works best using metrics as you have there “real view” into system as you won’t sample metrics. In that sense having sample of all of your traces makes sense, but not that much. Especially if you have really high volume traffic and not that many “interesting” (buggy) traces. What is more observability systems pricing is based on the volume of sent telemetries. So there are questions popping into your head like:
- “What if I would like to see more error traces?”
- “What if I would like to sample some app / group of apps at much higher rate?”
- “What if I would like to sample only slow traces?”
Yes! You guessed it. Answer for all those questions is tail sampling.
Tail (stateful) sampling
Just as you can imagine, tail sampling can make decisions after collecting the trace, because it is stateful. You can create more complex sampling decisions by using the Tail Sampling Processor. You can define rules based on e.g.:
- latency
- attributes (strings, numbers, booleans)
- probability (like in head sampling)
- trace status (errors)
- rate limit
and what is more you can also combine all of those together. Sounds great! How to start using it? Could I just replace sampling strategy and that’s it?

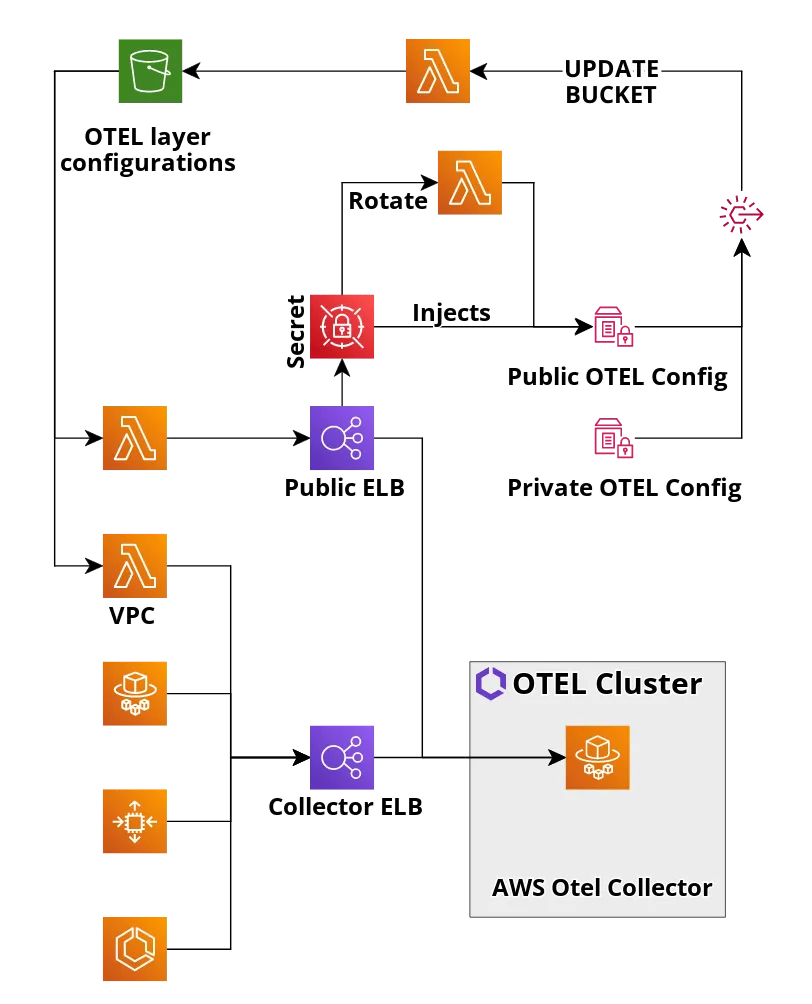
Architecture: Starting point
Let’s assume that we have state of infrastructure from previous article like one below:
Why we have to change it?
I have mentioned before that tail sampling is stateful. So it collects trace with all of its spans and only then it makes a decision.
What happens if we just update our definition to the one that uses tail sampling? Requests will flow into our ELB collector and then they would be sent to one of the instances under ELB. Here is the whole problem. We need to collect all spans for the same traceId in the same collector instance. Otherwise we won’t be able to make the right decision.
Is there any way we could do that with ELB? Not really. We need to change our architecture.

Architectural changes
Since v0.32.0 of ADOT there is new type of exporter available: loadbalancing exporter. This exporter routes incoming spans into further collector instances based on routing key (traceId or service). So we have to add a new layer of loadbalancing collectors in front of our current set of collectors. They will receive request and based on routing_key redirect spans directly to the proper collector node.

Collector nodes are discovered based on:
- static IPs list
- DNS name
- k8s
Now this is important. Our collectors have to be routed directly from loadbalancing collectors, if we will use ELB then collector will discover IPs of loadbalancer nodes instead of our collector nodes.
How can we achieve this easily? In our case we are using ECS with Fargate, so we can use great features of ECS — ECS Service Discovery or ECS Service Connect and have DNS routing based on service name as sophisticated as “otel-collector”. It will work in a very similar way with k8s. So our architecture will have been slightly updated into one on the diagram below:

Example configurations
Simple load balancing configuration:
receivers:
  otlp:
    protocols:
      grpc:
      http:
exporters:
  loadbalancing:
    protocol:
      otlp:
        compression: gzip
        tls:
          insecure: true
    resolver:
      dns:
        hostname: otel-collector.domain.com
        port: 4317
        interval: 15s
extensions:
  health_check:
service:
  extensions: [health_check]
  pipelines:
    traces:
      receivers: [otlp]
      exporters: [loadbalancing]
    metrics:
      receivers: [otlp]
      exporters: [loadbalancing]
Simple tail sampling policy with different sampling for errors and regular traces:
receivers:
  otlp:
    protocols:
      grpc:
      http:
processors:
  memory_limiter:
    check_interval: 15s
    limit_percentage: 60
    spike_limit_percentage: 20
  batch:
    send_batch_size: 2000
    timeout: 10s
  tail_sampling:
    decision_wait: 10s
    expected_new_traces_per_sec: 20000
    policies:
      - name: high-volume-apps-errors-sampling-policy
        type: and
        and:
          and_sub_policy:
            - name: error-policy
              type: status_code
              status_code:
                status_codes:
                  - "ERROR"
            - name: probabilistic-policy
              type: probabilistic
              probabilistic:
                sampling_percentage: 5
            - name: high-volume-apps-prefix-policy
              type: string_attribute
              string_attribute:
                key: service.name
                values:
                  - high-volume-apps*
                enabled_regex_matching: true
      - name: high-volume-apps-sampling
        type: and
        and:
          and_sub_policy:
            - name: high-volume-apps-prefix-policy
              type: string_attribute
              string_attribute:
                key: service.name
                values:
                  - high-volume-apps*
                enabled_regex_matching: true
            - name: high-volume-apps-probabilistic-policy
              type: probabilistic
              probabilistic:
                sampling_percentage: 1
      - name: low-volume-apps-errors-sampling-policy
        type: and
        and:
          and_sub_policy:
            - name: error-policy
              type: status_code
              status_code:
                status_codes:
                  - "ERROR"
            - name: probabilistic-policy
              type: probabilistic
              probabilistic:
                sampling_percentage: 100
            - name: low-volume-apps-prefix-policy
              type: string_attribute
              string_attribute:
                key: service.name
                values:
                  - low-volume-apps*
                enabled_regex_matching: true
      - name: low-volume-apps-sampling
        type: and
        and:
          and_sub_policy:
            - name: low-volume-apps-prefix-policy
              type: string_attribute
              string_attribute:
                key: service.name
                values:
                  - low-volume-apps*
                enabled_regex_matching: true
            - name: low-volume-apps-probabilistic-policy
              type: probabilistic
              probabilistic:
                sampling_percentage: 50
exporters:
  otlp:
    endpoint: https://otlp.nr-data.net:4317
    headers:
      api-key: ${YOUR_NR_KEY}
    compression: gzip
extensions:
  health_check:
service:
  extensions: [health_check]
  pipelines:
    traces:
      receivers: [otlp]
      processors: [tail_sampling, memory_limiter, batch]
      exporters: [otlp]
    metrics:
      receivers: [otlp]
      processors: [batch]
      exporters: [otlp]
Things to watch out
Exporting metrics
̶T̶h̶e̶ ̶l̶o̶a̶d̶ ̶b̶a̶l̶a̶n̶c̶i̶n̶g̶ ̶e̶x̶p̶o̶r̶t̶e̶r̶ ̶d̶o̶e̶s̶ ̶n̶o̶t̶ ̶s̶u̶p̶p̶o̶r̶t̶ ̶m̶e̶t̶r̶i̶c̶s̶,̶ ̶w̶h̶i̶c̶h̶ ̶t̶o̶t̶a̶l̶l̶y̶ ̶m̶a̶k̶e̶s̶ ̶s̶e̶n̶s̶e̶,̶ ̶b̶u̶t̶ ̶u̶n̶f̶o̶r̶t̶u̶n̶a̶t̶e̶l̶y̶ ̶m̶e̶t̶r̶i̶c̶s̶ ̶h̶a̶v̶e̶ ̶t̶o̶ ̶b̶e̶ ̶e̶x̶p̶o̶r̶t̶e̶d̶ ̶o̶n̶ ̶t̶h̶e̶ ̶L̶B̶ ̶c̶o̶l̶l̶e̶c̶t̶o̶r̶ ̶l̶a̶y̶e̶r̶ ̶t̶o̶ ̶y̶o̶u̶r̶ ̶t̶e̶l̶e̶m̶e̶t̶r̶y̶ ̶p̶r̶o̶v̶i̶d̶e̶r̶!̶
Exporting metrics are finally supported! :)
Scaling collector: DNS
During collector scaling, the list of discovered IPs may become outdated, so it’s important not to use long TTLs on DNS records.
Scaling collector: Dynamics
During collector scaling we will face typical rebalancing issues. It’s good practice to limit the number of scaling operations.
False Telemetry
You have to remember that if you come up with tail sampling rules that only collect traces with errors or only slow traces, then all your telemetry will be wrong. In most APM systems you will have service maps that show a completely distorted reality.
LoadBalancing Exporter Settings
It’s important to config retries and queues in your loadbalancing exporter setup according to: https://github.com/open-telemetry/opentelemetry-collector/tree/main/exporter/exporterhelper
Tail Sampling Processor Settings
It’s important to set parameters of tail sampling processor according to your system requirements and characteristics. Take a look at Tail Sampling Processor Docs which describes setup with:
decision_wait(default = 30s): Wait time since the first span of a trace before making a sampling decision
num_traces(default = 50000): Number of traces kept in memory
expected_new_traces_per_sec(default = 0): Expected number of new traces (helps in allocating data structures)
Summary
We are really happy about our current setup. We have now flexibility that was not possible with any other solution. We are now able to improve the way that we are collecting traces and pay for the data that really matters.
Cons:
- More complex infrastructure
- More expensive collectors instances— stateful machines consume more resources and we need additional layer of machines
Pros:
- Cheaper — in case you are storing less data in your observability provider which most probably will prevail cost of infrastructure
- Paying for more relevant data
- Flexibility in sampling