What we learned after running Airflow on Kubernetes for 2 years

Apache Airflow is one of the most important components in our Data Platform, used by different teams inside the business. It powers all of our data transformations, fraud detection mechanisms, data science initiatives, and many housekeeping and internal tasks we run at Teya.
To put it in perspective, we have over 300 DAGs in production, running more than 5.000 tasks per day, on average. So I would say that we have a medium-size Airflow deployment, capable of delivering value for our users. For more than 8 months now we have been running without a single incident or failure in Airflow.
With this post, I want to share important aspects of our deployment that helped us to achieve a scalable, and reliable environment. I hope it helps if you are starting your journey with Airflow in production right now, or want to evaluate some different ideas and incorporate them into your use case.
I will divide it according to key aspects that formed our current implementation of Airflow:
- Executor choice
- Decoupling and dynamic DAG generation
- Fine-tuning configurations
- Notifications, alerting, and observability
Executor choice
Here we run everything in Kubernetes. So it wouldn’t be different in the case of Airflow. At first, the executor choice seemed obvious: let’s use the Kubernetes Executor! All the advantages of having runtime isolation, seamless task scalability by leveraging Kubernetes, and fewer components to manage (it does not need a Celery backend e.g. Redis), all sounded very good. And that’s how we initiated our journey.
However, there is one important characteristic in our stack: the majority of tasks are lightweight DBT incremental transformations, and very few are long-running models (+/- 1 hour).
The first problem we faced was the overhead to initiate a task. As the KubernetesExecutor runs every task in a separate Pod, sometimes the waiting time to initiate the Pod was longer than the runtime of the task itself. As we have many small tasks, we had to constantly wait for the scaling out of Kubernetes nodes to accommodate the increasing number of Pods.
The second problem, and the one that caused more pain, was the unexpected failure of some tasks (especially the long-running ones) due to Pods being evicted. As the spike in tasks increased the number of Pods and consequently the number of Nodes in the cluster, as soon as the tasks were completed, the system was ready to scale back in again.
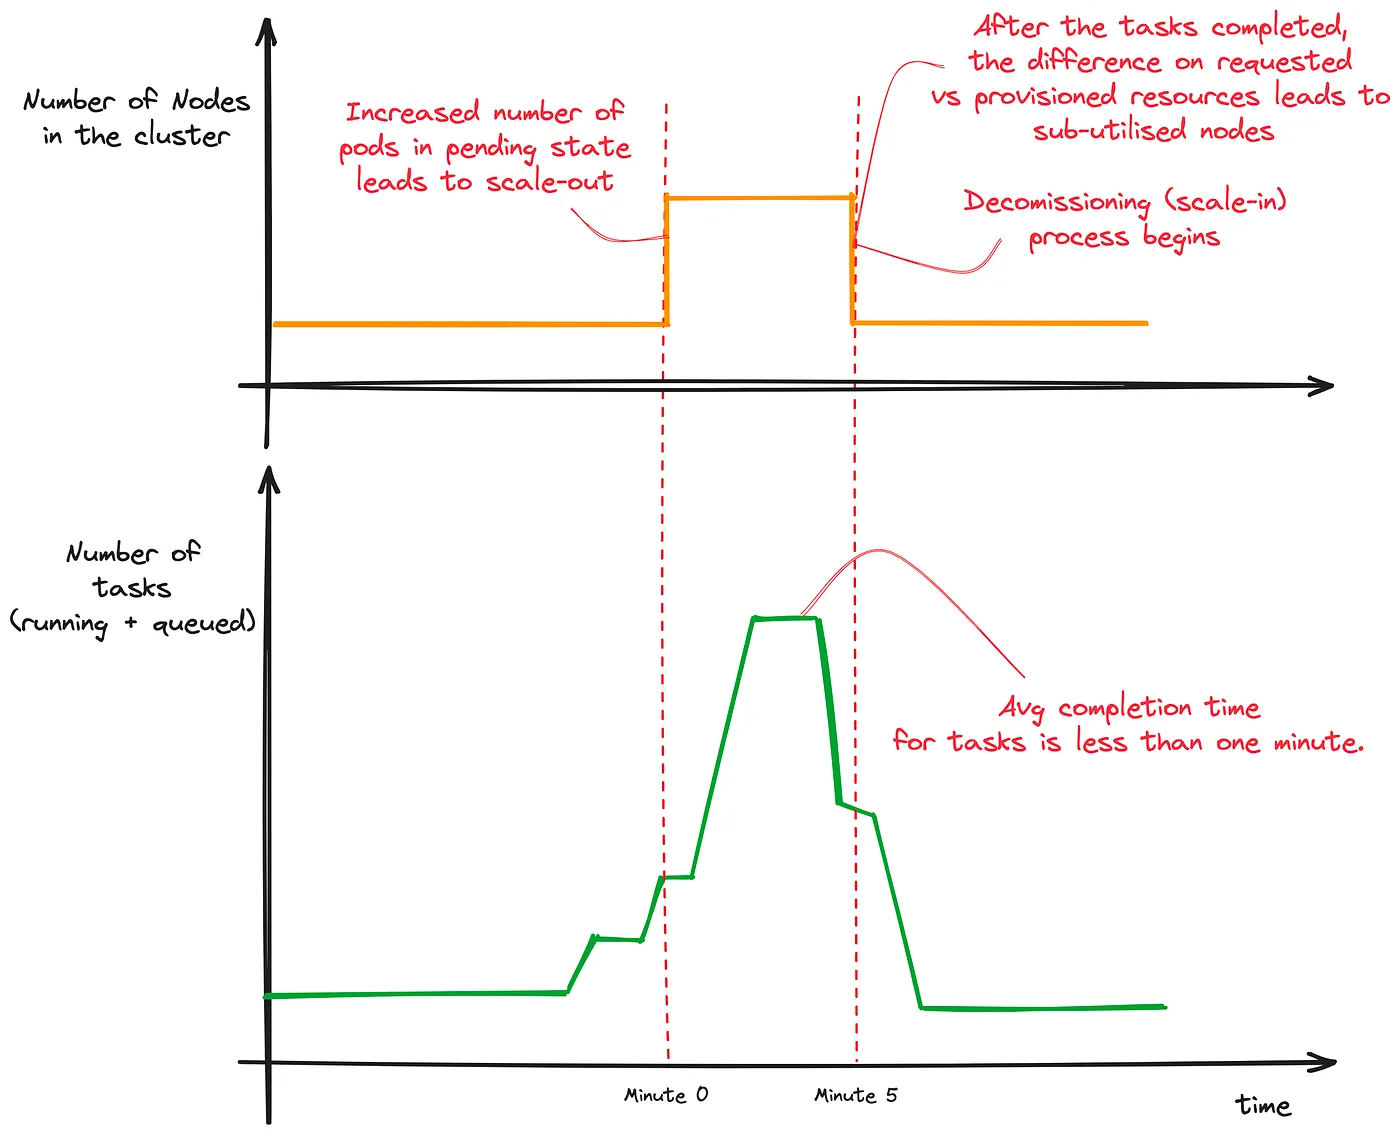
The problem was further exacerbated as we use Karpenter to optimize resource usage in our k8s cluster. So the scale-in of nodes happened very fast after a couple of Pods were completed. The behavior is to evict the remaining Pods on those nodes to re-distribute them to other nodes, thus reducing the number of total nodes and saving costs.
CeleryExecutor to the rescue
Considering all that, we decided to turn to the good old Celery Executor. By now having fixed worker nodes, it fits our use case of having many small and quick tasks perfectly. The average runtime of a DBT job decreased significantly as now we don’t have to wait before it initiates.
By using Airflow’s official latest helm chart, we can benefit from the KEDA autoscaler to increase or decrease the number of celery workers on demand, so we don’t pay extra costs for idle workers. It works by fetching the number of running and queued tasks in Airflow’s database and then scaling the number of workers accordingly, depending on your worker concurrency configuration.
For the case of custom jobs that require more resources, we have the option of running them using the KubernetesPodOperator. So we can still have runtime isolation for specific dependencies (without the need to install them in Airflow’s image), and the benefit of defining individual resource requests per task.
At the moment we are still considering the adoption of the KubernetesCeleryExecutor , as it enables jobs to be scheduled in two separate queues — the k8s and Celery one. It can be beneficial for scenarios when some jobs are more suited to Celery and other ones are more suited to Kubernetes.
Decoupling and dynamic DAG generation
The Data Engineering team is not the only one writing Airflow DAGs. To accommodate a scenario where individual teams will write their own DAGs, we needed a multi-repo approach for DAGs. But, at the same time, keep things consistent and enforce guidelines.
Supporting a multi-repo approach for DAGs
DAGs can be developed in individual repositories, owned by different teams, and still end up in the same Airflow instance. And of course, without embedding DAGs into Airflow’s image 😉
Trust me, you don’t want to restart the scheduler and workersevery time someone changes one line in a DAG.

Every DAG ends up in a bucket, by a sync process on specific paths relative to the teams owning those DAGs.
For this approach to work, a very important part is the CI/CD guardrails being enforced. Every DAG name must be pre-fixed with the team owning it, so we avoid having conflicting DAG IDs. Also, there is a static check on every DAG to verify proper owner assignments and the presence of tags, catch possible import errors, etc.
By doing that we can enforce access control using native Airflow roles, and every DAG must pass the minimum governance check-list to be committed.
But then how to sync DAGs into Airflow?
For the DAGs to be reflected in Airflow, we need to sync the contents of the bucket to the local filesystem of the Pods running the scheduler, workers, etc. To accomplish this we are using Objinsync, a lightweight daemon to incrementally synchronize remote object stores to the local filesystem.
We have objinsync running as a side container in every Airflow component Pod, doing the sync frequently. So we always catch new updates to DAGs in a few minutes. A lesson here was to also add objinsync as an init container, so it can sync DAGs even before the main scheduler or worker container starts. This proved to be especially important for the Celery workers — after being restarted due to a node rotation or release, sometimes a task would be assigned to the new worker that hasn’t fetched the DAGs yet, leading to an immediate failure.

The ideal way to do this would be to have only one objinsync process running as a side container in the scheduler and copying the bucket contents into a persistent volume. So that PV would be mounted into all Airflow components. The advantages here are that the DAGs would never get out-of-sync between different Airflow components.
Unfortunately, we can’t implement that solution here yet, since we currently only support EBS volumes for the cluster nodes. To mount a PV in different nodes, we need the ReadWriteMany access mode. This is only available at the moment in AWS EKS if you use the EFS volume mode.
A workaround for that, given our limitation, would be to use a nodeSelector to schedule all Airflow Pods in the same node. However, we chose to rather have a highly available Airflow deployment — by using nodes across different availability zones.
Be careful when generating DAGs dynamically
If you want to generate DAGs at scale, you need to leverage DAG templating and programmatic generation. No more writing every DAG by hand 😂
Perhaps the simplest way to generate a DAG dynamically is using the single-file method. You have one file that generates DAG objects in a loop and adds them to the globals() dictionary.
This method was very straightforward when we first started generating dynamic DAGs based on our DBT project (the topic of DBT orchestration requires a post on its own, and will be done in the future). However, as DAGs get parsed by the scheduler at regular intervals, we observed increased CPU and memory usage and larger scheduler loop times when using this method. Especially because the process required parsing the DBT manifest.json , which is a quite large file 😅. So this method soon proved to not be scalable given our project size.
The solution was to turn to the multiple-file method, in which we generate a .py file for every DAG we want to create dynamically. By doing that, we incorporated a DAG generation process into our DBT project repository. The project now becomes one more producer of DAGs, pushing the dynamically generated files to the DAGs bucket.
Astronomer has a great article on single-file methods and multiple-file methods here.
Fine-tuning configurations
As soon as we moved to the CeleryExecutor, despite solving one of our problems, new things started to go wrong. After a few days (or even hours) running, some of our Celery workers started dying from OOM (Out of Memory) problems. We were giving enough memory resources for the Pods, so something sounded off.
After investigation, this is what we saw on the Celery worker resource usage chart.

Our tasks are small, primarily consisting of DBT jobs executed by Celery workers. This nearly constant increase in memory usage puzzled us at that time. We began suspecting a memory leak between tasks.
To prevent memory leakage and also control the memory usage of tasks, we had to fine-tune two important Celery configurations: worker_max_tasks_per_child and worker_max_memory_per_child .
The first one controls the maximum number of tasks a worker process can execute before it is replaced by a new process. First, we need to understand the difference between Celery workers and worker processes. One worker node can spawn multiple worker processes, which are controlled by the concurrency setting. For example, if you have concurrency set to 12 and 2 Celery workers, you will end up with 24 worker processes.
Therefore, to avoid memory leakage between tasks in the same worker process, it is good to re-cycle it from time to time. If this configuration is not set, the default is to not re-cycle the worker process.
The second one, worker_max_memory_per_child , controls the maximum amount of resident memory that can be executed by a single worker process, before it is replaced by a new one. This controls the usage of memory by tasks, essentially. The default is also no limit, so it is always recommended to set this.
By tuning these two configurations we are controlling memory usage by recycling worker processes in two moments: if they reach the maximum number of tasks OR if they reach the maximum amount of resident memory. It is important to note that those configurations only work if you are using the prefork pool. More about it on the official docs.
To set them in Airflow is pretty simple. You just need to update the default Celery configs in Airflow’s config_templates folder, like the following:
# config_templates/custom_celery.py

from airflow.config_templates.default_celery import DEFAULT_CELERY_CONFIG

CUSTOM_CELERY_CONFIG = DEFAULT_CELERY_CONFIG.copy()
CUSTOM_CELERY_CONFIG.update(
    {
        "worker_max_tasks_per_child": <int>,
        "worker_max_memory_per_child": <int>,
    }
)
And then you point to this custom config in values.yaml
airflow:
   config:
     celery:
       worker_concurrency: <int>
       celery_config_options: config_templates.custom_celery.CUSTOM_CELERY_CONFIG
The specific values that you use for those configurations are going to depend on your worker node configurations, the amount of memory requests/limits, your concurrency level, and how memory-intensive are your tasks. That’s why you need to fine-tune it to your specific setup.
Be prepared for node rotations
A k8s node can rotate if it experiences malfunctioning or due to a scheduled node rotation set by the infrastructure team managing the Kubernetes cluster. Also, worker nodes (Pods) rotate in the event of a release, when you are changing some configuration (like environment variables) or the base image. Node rotations of course lead to Pods being terminated.
We need to be prepared for these events and make sure that our tasks don’t simply fail due to a Pod being decommissioned. This can be especially painful for long-running tasks. Imagine running a job for 2–3 hours and having it fail due to a scheduled node rotation.
To prevent that, it is important to set the Worker Termination Grace Period configuration according to your individual needs. This configuration is going to make the celery worker wait up to that number of seconds, before being shut down by a release process or node rotation. This can also be easily set in Airflow’s charts values.yaml
airflow:
   workers:
      terminationGracePeriodSeconds: <int>
The recommendation is to set it up to 1.5x the amount of time your longest-running task takes to complete, on average. So we are safe that every task will be completed under that period and the worker can be shut down gracefully.
Notifications, alerting, and observability
Unify your company notifications
One of the most common use cases of Airflow is to send custom notifications after certain task events, like processing files, clean-up jobs, or even task failures. If you are working in an environment where multiple teams are using Airflow, you should unify the notifications mechanism.
This is to avoid Team A sending Slack messages from Airflow in a completely different format than Team B does, for instance.
Since Airflow 2.6, we can use Notifiers to manage that. There is already a set of pre-built notifiers by the community to account for the most common use cases: Slack, SQS, Jira, etc.
Here, we created our own custom Notifier from the BaseNotifier class, so we can tailor notification templates to our needs and embed custom behavior. For example, when running tasks in the dev environment, we send notifications on failure only to Slack by default. When in prd , notifications are sent to our on-call tool, Opsgenie.

Custom notifications are also templated so teams can use them in a standard format to create info messages in Slack, for example. Another advantage of this approach is that individual teams using it do not need to worry about managing the secrets of the individual notification targets.
Be the first one to know about a failure
Even though we implement best practices and patterns of high availability, Airflow can still fail for many reasons. That’s why observability, metrics, and alerting on the infrastructure level are very important.
When running in Kubernetes, you can do that by setting PrometheusRule for every event of interest. For instance, to monitor the health of the scheduler nodes, the number of available worker nodes, or even to monitor a specific Airflow metric like the scheduler loop time. By also running AlertManager , you can fire alerts to various targets of interest (Slack, PagerDuty, Opsgenie, etc.).
Another wise thing to do is to leverage Airflow metrics to improve the observability of your environment. At the moment of writing this, Airflow supports sending metrics to both StatsD and OpenTelemetry . The latter is preferred over the former, since OpenTelemetry is a more complete framework that also supports Logs and Traces. However, currently, Airflow does not support logs and tracing through OTEL yet (but will do so in the future!).
Also, if you want to use it, you will need to manage the OTEL Collector deployment in Kubernetes (here is the official helm chart). Unlike statsd, the official Airflow charts do not provide the OTEL Collector.

Alerting improves a lot with the standard metrics. For example, you can use the total number of queued tasks and set alerts to trigger when the queue increases too much over a specific amount of time — you don't want queues longer than your SLA times, for example.
Other useful metrics we monitor are the DAG parsing time and Scheduler loop time, to quickly identify problems that might be affecting Airflow in its core and slowing down the whole application.
Take care of Airflow’s metadata
The metadata database is a crucial part of a successful Airflow implementation, as it can undermine its performance or even take Airflow down.
Besides the monitoring of Airflow nodes and performance metrics mentioned above, it is also crucial to monitor your database health metrics. This will most likely vary depending if you are using PostgreSQL or MySQL (please don’t use SQLite 😂), but the most common metrics are CPU usage, available storage, number of opened connections, etc.
Another good practice is to periodically run metadata clean-up jobs to remove old and unused metadata. This can include tables like job, dag_run, task_instance, log, xcom, sla_miss, dags, task_reschedule, task_fail , etc. All of this metadata keeps building inside Airflow and making the average query to fetch a task status, for example, longer than it needs to be. Also, have you ever felt that Airflow is simply slow to load and navigate? Metadata build-up can be the cause of that.
Fortunately, Airflow provides a native command for that, airflow db clean — with optional flags to configure its behavior. See it in detail here.
A good approach for that if you are using Kubernetes is to set a CronJob as an additional resource in Airflow’s chart, to periodically run the airflow db clean command with the flags you specify. Depending on the size of your implementation, you might need to run this daily or weekly.
Conclusion
I hope this text can shine some light on the subject and help teams that are starting their journey with Airflow on Kubernetes, especially in a more collaborative environment where multiple teams are using the same Airflow cluster.
Many other components and details that contribute to a successful implementation were not mentioned here. We still have a lot to improve and a long way to go. If you would like to share your experiences as well or ask questions, please feel free to reach out to me and let’s chat 😄