AWS Public Sector Blog
Open data helps recovery in the aftermath of devastating weather events
Severe and extreme weather events not only wreak havoc on lives, property and the economy, but the extent of the destruction and devastation left behind can be difficult to map and quantify. Having high resolution imagery of areas devastated by weather events (hurricanes, tornadoes, floods, and etc.) helps to characterize impacts, formulate needed recovery and response activities, support emergency managers in saving lives, and restart the flow of commerce. The National Oceanic and Atmospheric Administration’s (NOAA’s) data plays a critical role in this process.
As part of the Amazon Sustainability Data Initiative (ASDI), we invited Jena Kent, communications/engagement and co-technical lead from NOAA’s Big Data Program, to share how Amazon Web Services (AWS) is helping with disaster response by providing access to aerial data and imagery through open data initiatives.
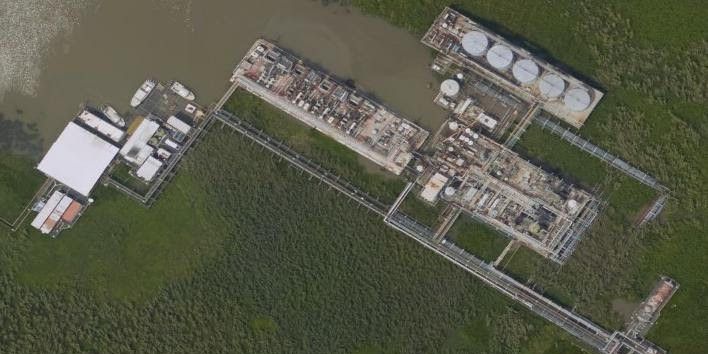
Hurricane imagery was acquired by the NOAA Remote Sensing Division (RSD) to support NOAA Homeland Security and emergency response requirements. Additionally, it will be used for ongoing research efforts for testing and developing standards for airborne digital imagery. Individual images have been combined into a larger mosaic and tiled for distribution. The approximate ground sample distance (GSD) for each pixel is ~25 cm/zoom level 19. This rapid response product was generated for use by emergency managers for visual analysis of damage in the area. It is not intended for mapping, charting or navigation. It will also be used for ongoing research efforts for testing and developing standards for airborne digital imagery. (https://storms.ngs.noaa.gov/)
NOAA National Geodetic Survey’s critical role
After severe, extreme weather events (e.g., hurricanes and flooding events), one of the most challenging activities is to identify the level of destruction left behind and assess how much infrastructure has been destroyed or relocated. Timely access to baseline (prior to event) and post event remote sensing imagery over those affected areas is critical to take action and make sure that lives and property are protected.
NOAA’s aerial imagery aids safe navigation and captures damage to coastal areas caused by a storm. Aerial imagery is a crucial tool to determine the extent of the damage inflicted by an event, and to compare baseline coastal areas to assess the damage to major ports and waterways, coastlines, critical infrastructure, and coastal communities. This imagery provides a cost-effective way to better understand the damage sustained to both property and the environment.
This is where NOAA’s National Geodetic Survey (NGS) team, as part of the National Ocean Service, comes in. Their Remote Sensing Division (RSD) acquires and disseminates remotely sensed data through NGS’s coastal (pre-event imagery) and aerial imagery viewers on their website. Using the viewers, a user can explore a variety of remote-sensing datasets to support coastal mapping, homeland security and emergency response requirements.
Most frequently, RSD uses digital aerial cameras to collect this information, providing high-resolution geo-referenced images to federal, state, and local partners, and the general public. These images assisted in the response and recovery efforts along coastlines impacted by numerous major hurricanes and floods. This effort first started in 2003, and was critical in supporting recovery when Hurricane Isabel hit the east coast of the US that same year and has been consistently used for events like Hurricane Katrina in 2005, Hurricane Sandy in 2012, and Hurricanes Irma, Harvey and Maria in 2017. NOAA traditionally makes these images, called Emergency Response Imagery (ERI), available via NOAA’s National Geodetic Survey’s webpage, where users can browse and assess storm damage through an interactive map called the ERI Viewer.
Removing barriers to access and use the ERI data
In an effort to increase access and visibility to these images, NOAA ERI data is now available through the NOAA Big Data Program (BDP). NOAA ERI data is now available in the AWS Cloud and the images are discoverable through the Registry of Open Data on AWS as soon as they are posted. The NOAA BDP team retains complete control and ownership of the ERI data distributed through AWS. Through ASDI and the AWS Open Data Sponsorship Program, AWS covers the costs of storing and egressing the data, and supports the NOAA BDP team with technical support, as needed. This helps maintain and preserve the integrity of the data, and that only NOAA controls which data is distributed through the AWS Cloud. ERI data from severe weather events starting in 2005 are available on AWS. In addition to the native JPEG format, the data catalog on AWS provides the data also in Cloud Optimized GeoTiff (COG) format to enable easier analysis of the data in the cloud.
Strong collaborations build strong outcomes
This work is possible due to the collaboration between NOAA BDP, ASDI, and the AWS Open Data Program. By providing NOAA’s ERI data to the public via an Amazon Simple Storage Service (Amazon S3) bucket, users can access and analyze data in the cloud with low latency, and use other AWS services as well as other datasets available in the ASDI catalog. This simplified access to cloud services is particularly helpful for users performing artificial intelligence (AI), structure from motion (SfM), and GIS analysis.
To learn more about the Amazon Sustainability Data Initiative (ASDI) visit us at amazonsdi.com.