Containers
Monitoring your service mesh container environment using Amazon Managed Service for Prometheus
Observability is critical for any application and to understand system behavior and performance. It takes a lot of time and effort to detect and remediate performance slowdowns or disruptions. It’s even more challenging in a multi-tenant environment where numerous microservices are running and the processing of a request spans a handful of services. Service meshes handle the network communication between microservices.
It’s easy to feel lost when you’re troubleshooting such a complex environment. Not only do application traces play an important role in identifying performance issues, so do the metrics for the service mesh component. Prometheus is a widely used open source systems monitoring and alerting solution. It includes an alert manager to route, group, and silence alerts. It also provides a multi-dimensional data model with time series data identified by metric name and key-value pairs and a flexible query language for aggregating metrics across a high volume of labels. To instantly query, correlate, and visualize operational metrics collected by Prometheus, we use Grafana, a widely deployed visualization tool.
Although it’s easy to deploy Prometheus and Grafana, it can take a significant amount of engineering effort to scale across multiple servers and configure a highly available, scalable, and secure environment. You have to commit more time to optimize resources like memory and storage to control costs and improve query response times. Maintaining the environment on an ongoing basis, including patching and upgrading Prometheus servers, is a chore. With the help of Amazon Managed Service for Prometheus (AMP) and Amazon Managed Service for Grafana (AMG), you can operate a Prometheus service that can scale on demand without impacting the ability to monitor critical resources.
AMP is a Prometheus-compatible monitoring service for container infrastructure and application metrics for containers that makes it easy to securely monitor container environments at scale. With AMP, you can automatically scale the ingestion, storage, and querying of operational metrics as workloads scale up and down. AMG is a fully managed service that makes it easy for you to visualize and analyze operational data at scale.
Envoy metrics
Organizations are expanding their microservices footprint with the help of orchestration engines like Amazon Elastic Kubernetes Service (Amazon EKS) and Amazon Elastic Container Service (Amazon ECS). They often have applications owned by different teams running in different AWS accounts or VPCs and rely on a service mesh like AWS App Mesh to get consistent connectivity, observability, and security between applications. App Mesh is a managed service mesh that can be used with Amazon ECS, Amazon EKS, Amazon Elastic Compute Cloud (Amazon EC2) instances, and with self-managed Kubernetes on EC2. App Mesh makes it easy to connect applications running on different compute platforms into a common mesh. App Mesh uses the envoy proxy to standardize communication between applications, which provides end-to-end visibility and helps ensure high availability. Although AMP and AMG act as single source of truth by ingesting metrics from containers across the organization running on different compute platforms, it’s important to gather envoy metrics, too. Envoy is an integral part of App Mesh, which helps route traffic between different applications.
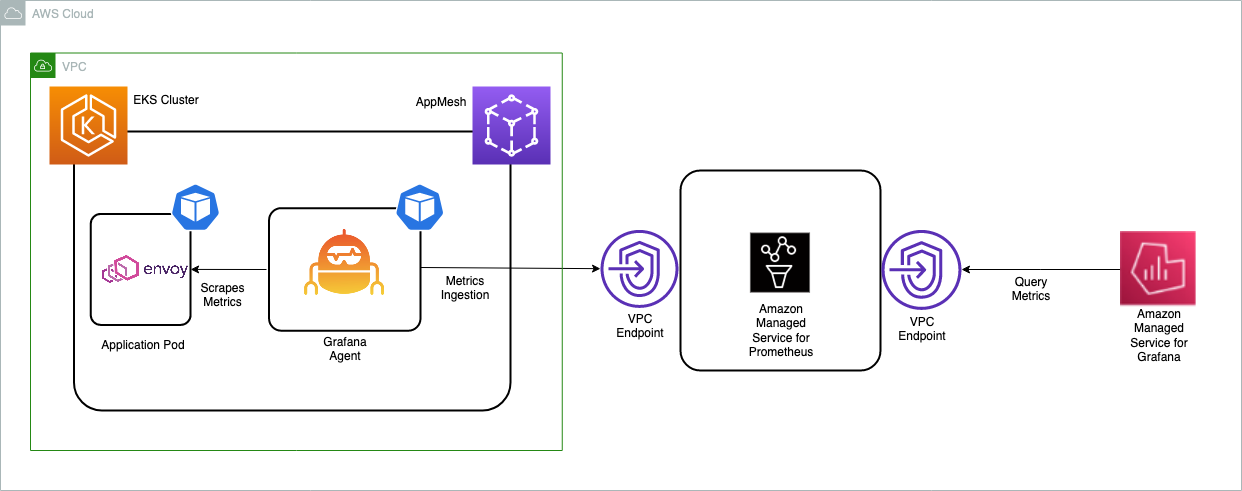
In this blog post, we will walk through the steps to ingest App Mesh envoy metrics in an Amazon EKS cluster to AMP and create a custom dashboard on AMG to monitor the health and performance of microservices.
As a part of implementing the solution, we:
- Create an AMP workspace.
- Install the App Mesh Controller for Kubernetes and inject the envoy container into the pods.
- Collecting Envoy metrics using Grafana Agent configured in the Amazon EKS cluster and write them to AMP.
- Create an AMG workspace and configure AMP as a data source.
- Create and configure the Grafana dashboard on AMG.
Prerequisites
You will need the following to complete the steps in this blog post:
- AWS CLI version 2
- eksctl
- kubectl
- jq
- helm
- An AMP workspace configured in your AWS account. For instructions, see Create a workspace in the AMP User Guide.
- AWS Single Sign-On (AWS SSO). For instructions, see Enable AWS SSO in the AWS Single Sign-On User Guide.
Create an EKS cluster
First, create an EKS cluster that will be enabled with App Mesh for running the sample application. The eksctl CLI tool will be used to deploy the cluster using the eks-cluster-config.yaml file:
export AMP_EKS_CLUSTER=AMP-EKS-CLUSTER
export AMP_ACCOUNT_ID=<Your Account id>
export AWS_REGION=<Your Region>


cat << EOF > eks-cluster-config.yaml
---
apiVersion: eksctl.io/v1alpha5
kind: ClusterConfig
metadata:
  name: $AMP_EKS_CLUSTER
  region: $AWS_REGION
  version: '1.18'
iam:
  withOIDC: true
  serviceAccounts:
  - metadata:
      name: appmesh-controller
      namespace: appmesh-system
      labels: {aws-usage: "application"}
    attachPolicyARNs:
    - "arn:aws:iam::aws:policy/AWSAppMeshFullAccess"
managedNodeGroups:
- name: default-ng
  minSize: 1
  maxSize: 3
  desiredCapacity: 2
  labels: {role: mngworker}
  iam:
    withAddonPolicies:
      certManager: true
      cloudWatch: true
      appMesh: true
cloudWatch:
  clusterLogging:
    enableTypes: ["*"]
EOF
Execute the following command to create the EKS cluster:
eksctl create cluster -f eks-cluster-config.yamlThis creates an EKS cluster named AMP-EKS-CLUSTER and a service account named appmesh-controller that will be used by the App Mesh controller for EKS.
Next, use the following commands to install the App Mesh controller.
First, get the Custom Resource Definitions (CRDs) in place:
helm repo add eks https://aws.github.io/eks-charts
helm upgrade -i appmesh-controller eks/appmesh-controller \
--namespace appmesh-system \
--set region=${AWS_REGION} \
--set serviceAccount.create=false \
--set serviceAccount.name=appmesh-controller
Create an AMP workspace
The AMP workspace is used to ingest the Prometheus metrics collected from envoy. A workspace is a logical and isolated Prometheus server dedicated to Prometheus resources such as metrics. A workspace supports fine-grained access control for authorizing its management such as update, list, describe, and delete, and the ingestion and querying of metrics.
aws amp create-workspace --alias AMP-APPMESH --region $AWS_REGIONNext, as an optional step, create an interface VPC endpoint to securely access the managed service from resources deployed in your VPC. A public endpoint for AMP is also available. This ensures that data ingested by the managed service does not leave the VPC in your AWS account. You can use the AWS CLI as shown here. Replace the placeholder strings such as VPC_ID, AWS_REGION, and others with your values.
export VPC_ID=<Your EKS Cluster VPC Id>

aws ec2 create-vpc-endpoint \
--vpc-id $VPC_ID \
--service-name com.amazonaws.<$AWS_REGION>.aps-workspaces \
--security-group-ids <SECURITY_GROUP_IDS> \
--vpc-endpoint-type Interface \
--subnet-ids <SUBNET_IDS>

helm repo add prometheus-community https://prometheus-community.github.io/helm-charts
helm repo add kube-state-metrics https://kubernetes.github.io/kube-state-metrics
Scrape the metrics
AMP does not directly scrape operational metrics from containerized workloads in a Kubernetes cluster. You must deploy and manage a Prometheus server or an OpenTelemetry agent such as the AWS Distro for OpenTelemetry Collector or the Grafana Agent to perform this task. In this blog post, we walk you through the process of configuring the Grafana Agent to scrape the envoy metrics and analyze them using AMP and AMG.
Configure the Grafana Agent for AMP
The Grafana Agent is a lightweight alternative to running a full Prometheus server. It keeps the necessary parts for discovering and scraping Prometheus exporters and sending metrics to a Prometheus-compatible backend, which in this case is AMP, and removes subsystems such as the storage, query, and alerting engines. The Grafana Agent is 100 percent compatible with Prometheus metrics and uses the Prometheus service discovery, scraping, write-ahead log, and remote write mechanisms from the Prometheus project. The Grafana Agent also supports basic sharding across every node in your Amazon EKS cluster by only collecting metrics running on the same node as the Grafana Agent pod, removing the need to decide between one giant machine to collect all of your Prometheus metrics and sharding through multiple manually managed Prometheus configurations. The Grafana Agent also includes native support for AWS Signature Version 4 for AWS Identity and Access Management (IAM) authentication, which means you don’t need to run a sidecar Signature Version 4 proxy, which reduces complexity, memory, and CPU demand.
In this blog post, we walk through the steps to configure an IAM role to send Prometheus metrics to AMP. We install the Grafana Agent on the EKS cluster and forward metrics to AMP.
Configure permissions
The Grafana Agent scrapes operational metrics from containerized workloads running in the Amazon EKS cluster and sends them to AMP for long-term storage and subsequent querying by monitoring tools such as Grafana. Data sent to AMP must be signed with valid AWS credentials using the AWS Signature Version 4 algorithm to authenticate and authorize each client request for the managed service.
The Grafana Agent can be deployed to an Amazon EKS cluster to run under the identity of a Kubernetes service account. With IAM roles for service accounts (IRSA), you can associate an IAM role with a Kubernetes service account and thus provide IAM permissions to any pod that uses the service account. This follows the principle of least privilege by using IRSA to securely configure the Grafana Agent, which includes the AWS Signature Version 4 that helps ingest Prometheus metrics to AMP.
The agent-permissions-aks shell script can be used to execute the following actions. Replace the placeholder variable YOUR_EKS_CLUSTER_NAME with the name of your Amazon EKS cluster.
- Creates an IAM role named EKS-GrafanaAgent-AMP-ServiceAccount-Role with an IAM policy that has permissions to remote-write into an AMP workspace.
- Creates a Kubernetes service account named grafana-agent under the grafana-agent namespace that is associated with the IAM role.
- Creates a trust relationship between the IAM role and the OIDC provider hosted in your Amazon EKS cluster.
You need kubectl and eksctl CLI tools to run the script. They must be configured to access your Amazon EKS cluster.
kubectl create namespace grafana-agent
export WORKSPACE=$(aws amp list-workspaces | jq -r '.workspaces[] | select(.alias=="AMP-APPMESH").workspaceId')
export ROLE_ARN=$(aws iam get-role --role-name EKS-GrafanaAgent-AMP-ServiceAccount-Role --query Role.Arn --output text)
export REGION=$AWS_REGION
export NAMESPACE="grafana-agent"
export REMOTE_WRITE_URL="https://aps-workspaces.$REGION.amazonaws.com/workspaces/$WORKSPACE/api/v1/remote_write"
Now create a manifest file, grafana-agent.yaml, with the scrape configuration to extract envoy metrics and deploy the Grafana Agent. This example deploys a DaemonSet named grafana-agent and a deployment (with one replica) named grafana-agent-deployment. The grafana-agent DaemonSet collects metrics from pods on the cluster. The grafana-agent-deployment collects metrics from services that do not live on the cluster, such as the Amazon EKS control plane. At the time of this writing, this solution will not work for the AWS Fargate data plane due to the lack of support for DaemonSet.
cat > grafana-agent.yaml <<EOF
apiVersion: v1
kind: ServiceAccount
metadata:
  annotations:
    eks.amazonaws.com/role-arn: ${ROLE_ARN}
  name: grafana-agent
  namespace: ${NAMESPACE}
---
apiVersion: v1
data:
  agent.yml: |
    prometheus:
        configs:
          - host_filter: true
            name: agent
            remote_write:
              - sigv4:
                    enabled: true
                    region: ${REGION}
                url: ${REMOTE_WRITE_URL}
            scrape_configs:
              - job_name: 'appmesh-envoy'
                metrics_path: /stats/prometheus
                kubernetes_sd_configs:
                - role: pod
                relabel_configs:
                - source_labels: [__meta_kubernetes_pod_container_name]
                  action: keep
                  regex: '^envoy$'
                - source_labels: [__address__, __meta_kubernetes_pod_annotation_prometheus_io_port]
                  action: replace
                  regex: ([^:]+)(?::\d+)?;(\d+)
                  replacement: \${1}:9901
                  target_label: __address__
                - action: labelmap
                  regex: __meta_kubernetes_pod_label_(.+)
                - source_labels: [__meta_kubernetes_namespace]
                  action: replace
                  target_label: namespace
                - source_labels: ['app']
                  action: replace
                  target_label: service
                - source_labels: [__meta_kubernetes_pod_name]
                  action: replace
                  target_label: kubernetes_pod_name
              - bearer_token_file: /var/run/secrets/kubernetes.io/serviceaccount/token
                job_name: kubernetes-pods
                kubernetes_sd_configs:
                  - role: pod
                relabel_configs:
                  - action: drop
                    regex: "false"
                    source_labels:
                      - __meta_kubernetes_pod_annotation_prometheus_io_scrape
                  - action: keep
                    regex: .*-metrics
                    source_labels:
                      - __meta_kubernetes_pod_container_port_name
                  - action: replace
                    regex: (https?)
                    replacement: \$1
                    source_labels:
                      - __meta_kubernetes_pod_annotation_prometheus_io_scheme
                    target_label: __scheme__
                  - action: replace
                    regex: (.+)
                    replacement: \$1
                    source_labels:
                      - __meta_kubernetes_pod_annotation_prometheus_io_path
                    target_label: __metrics_path__
                  - action: replace
                    regex: (.+?)(\:\d+)?;(\d+)
                    replacement: \$1:\$3
                    source_labels:
                      - __address__
                      - __meta_kubernetes_pod_annotation_prometheus_io_port
                    target_label: __address__
                  - action: drop
                    regex: ""
                    source_labels:
                      - __meta_kubernetes_pod_label_name
                  - action: replace
                    replacement: \$1
                    separator: /
                    source_labels:
                      - __meta_kubernetes_namespace
                      - __meta_kubernetes_pod_label_name
                    target_label: job
                  - action: replace
                    source_labels:
                      - __meta_kubernetes_namespace
                    target_label: namespace
                  - action: replace
                    source_labels:
                      - __meta_kubernetes_pod_name
                    target_label: pod
                  - action: replace
                    source_labels:
                      - __meta_kubernetes_pod_container_name
                    target_label: container
                  - action: replace
                    separator: ':'
                    source_labels:
                      - __meta_kubernetes_pod_name
                      - __meta_kubernetes_pod_container_name
                      - __meta_kubernetes_pod_container_port_name
                    target_label: instance
                  - action: labelmap
                    regex: __meta_kubernetes_pod_annotation_prometheus_io_param_(.+)
                    replacement: __param_\$1
                  - action: drop
                    regex: Succeeded|Failed
                    source_labels:
                      - __meta_kubernetes_pod_phase
                tls_config:
                    ca_file: /var/run/secrets/kubernetes.io/serviceaccount/ca.crt
                    insecure_skip_verify: false
              - bearer_token_file: /var/run/secrets/kubernetes.io/serviceaccount/token
                job_name: ${NAMESPACE}/kube-state-metrics
                kubernetes_sd_configs:
                  - namespaces:
                        names:
                          - ${NAMESPACE}
                    role: pod
                relabel_configs:
                  - action: keep
                    regex: kube-state-metrics
                    source_labels:
                      - __meta_kubernetes_pod_label_name
                  - action: replace
                    separator: ':'
                    source_labels:
                      - __meta_kubernetes_pod_name
                      - __meta_kubernetes_pod_container_name
                      - __meta_kubernetes_pod_container_port_name
                    target_label: instance
                tls_config:
                    ca_file: /var/run/secrets/kubernetes.io/serviceaccount/ca.crt
                    insecure_skip_verify: false
              - bearer_token_file: /var/run/secrets/kubernetes.io/serviceaccount/token
                job_name: ${NAMESPACE}/node-exporter
                kubernetes_sd_configs:
                  - namespaces:
                        names:
                          - ${NAMESPACE}
                    role: pod
                relabel_configs:
                  - action: keep
                    regex: node-exporter
                    source_labels:
                      - __meta_kubernetes_pod_label_name
                  - action: replace
                    source_labels:
                      - __meta_kubernetes_pod_node_name
                    target_label: instance
                  - action: replace
                    source_labels:
                      - __meta_kubernetes_namespace
                    target_label: namespace
                tls_config:
                    ca_file: /var/run/secrets/kubernetes.io/serviceaccount/ca.crt
                    insecure_skip_verify: false
              - bearer_token_file: /var/run/secrets/kubernetes.io/serviceaccount/token
                job_name: kube-system/kubelet
                kubernetes_sd_configs:
                  - role: node
                relabel_configs:
                  - replacement: kubernetes.default.svc.cluster.local:443
                    target_label: __address__
                  - replacement: https
                    target_label: __scheme__
                  - regex: (.+)
                    replacement: /api/v1/nodes/\${1}/proxy/metrics
                    source_labels:
                      - __meta_kubernetes_node_name
                    target_label: __metrics_path__
                tls_config:
                    ca_file: /var/run/secrets/kubernetes.io/serviceaccount/ca.crt
                    insecure_skip_verify: false
              - bearer_token_file: /var/run/secrets/kubernetes.io/serviceaccount/token
                job_name: kube-system/cadvisor
                kubernetes_sd_configs:
                  - role: node
                metric_relabel_configs:
                  - action: drop
                    regex: container_([a-z_]+);
                    source_labels:
                      - __name__
                      - image
                  - action: drop
                    regex: container_(network_tcp_usage_total|network_udp_usage_total|tasks_state|cpu_load_average_10s)
                    source_labels:
                      - __name__
                relabel_configs:
                  - replacement: kubernetes.default.svc.cluster.local:443
                    target_label: __address__
                  - regex: (.+)
                    replacement: /api/v1/nodes/\${1}/proxy/metrics/cadvisor
                    source_labels:
                      - __meta_kubernetes_node_name
                    target_label: __metrics_path__
                scheme: https
                tls_config:
                    ca_file: /var/run/secrets/kubernetes.io/serviceaccount/ca.crt
                    insecure_skip_verify: false
        global:
            scrape_interval: 15s
        wal_directory: /var/lib/agent/data
    server:
        log_level: info
kind: ConfigMap
metadata:
  name: grafana-agent
  namespace: ${NAMESPACE}
---
apiVersion: v1
data:
  agent.yml: |
    prometheus:
        configs:
          - host_filter: false
            name: agent
            remote_write:
              - sigv4:
                    enabled: true
                    region: ${REGION}
                url: ${REMOTE_WRITE_URL}
            scrape_configs:
              - bearer_token_file: /var/run/secrets/kubernetes.io/serviceaccount/token
                job_name: default/kubernetes
                kubernetes_sd_configs:
                  - role: endpoints
                metric_relabel_configs:
                  - action: drop
                    regex: apiserver_admission_controller_admission_latencies_seconds_.*
                    source_labels:
                      - __name__
                  - action: drop
                    regex: apiserver_admission_step_admission_latencies_seconds_.*
                    source_labels:
                      - __name__
                relabel_configs:
                  - action: keep
                    regex: apiserver
                    source_labels:
                      - __meta_kubernetes_service_label_component
                scheme: https
                tls_config:
                    ca_file: /var/run/secrets/kubernetes.io/serviceaccount/ca.crt
                    insecure_skip_verify: false
                    server_name: kubernetes
        global:
            scrape_interval: 15s
        wal_directory: /var/lib/agent/data
    server:
        log_level: info
kind: ConfigMap
metadata:
  name: grafana-agent-deployment
  namespace: ${NAMESPACE}
---
apiVersion: rbac.authorization.k8s.io/v1beta1
kind: ClusterRole
metadata:
  name: grafana-agent
rules:
- apiGroups:
  - ""
  resources:
  - nodes
  - nodes/proxy
  - services
  - endpoints
  - pods
  verbs:
  - get
  - list
  - watch
- nonResourceURLs:
  - /metrics
  verbs:
  - get
---
apiVersion: rbac.authorization.k8s.io/v1beta1
kind: ClusterRoleBinding
metadata:
  name: grafana-agent
roleRef:
  apiGroup: rbac.authorization.k8s.io
  kind: ClusterRole
  name: grafana-agent
subjects:
- kind: ServiceAccount
  name: grafana-agent
  namespace: ${NAMESPACE}
---
apiVersion: apps/v1
kind: DaemonSet
metadata:
  name: grafana-agent
  namespace: ${NAMESPACE}
spec:
  minReadySeconds: 10
  selector:
    matchLabels:
      name: grafana-agent
  template:
    metadata:
      labels:
        name: grafana-agent
    spec:
      containers:
      - args:
        - -config.file=/etc/agent/agent.yml
        - -prometheus.wal-directory=/tmp/agent/data
        command:
        - /bin/agent
        env:
        - name: HOSTNAME
          valueFrom:
            fieldRef:
              fieldPath: spec.nodeName
        image: grafana/agent:v0.11.0
        imagePullPolicy: IfNotPresent
        name: agent
        ports:
        - containerPort: 80
          name: http-metrics
        securityContext:
          privileged: true
          runAsUser: 0
        volumeMounts:
        - mountPath: /etc/agent
          name: grafana-agent
      serviceAccount: grafana-agent
      tolerations:
      - effect: NoSchedule
        operator: Exists
      volumes:
      - configMap:
          name: grafana-agent
        name: grafana-agent
  updateStrategy:
    type: RollingUpdate
---
apiVersion: apps/v1
kind: Deployment
metadata:
  name: grafana-agent-deployment
  namespace: ${NAMESPACE}
spec:
  minReadySeconds: 10
  replicas: 1
  revisionHistoryLimit: 10
  selector:
    matchLabels:
      name: grafana-agent-deployment
  template:
    metadata:
      labels:
        name: grafana-agent-deployment
    spec:
      containers:
      - args:
        - -config.file=/etc/agent/agent.yml
        - -prometheus.wal-directory=/tmp/agent/data
        command:
        - /bin/agent
        env:
        - name: HOSTNAME
          valueFrom:
            fieldRef:
              fieldPath: spec.nodeName
        image: grafana/agent:v0.11.0
        imagePullPolicy: IfNotPresent
        name: agent
        ports:
        - containerPort: 80
          name: http-metrics
        securityContext:
          privileged: true
          runAsUser: 0
        volumeMounts:
        - mountPath: /etc/agent
          name: grafana-agent-deployment
      serviceAccount: grafana-agent
      volumes:
      - configMap:
          name: grafana-agent-deployment
        name: grafana-agent-deployment
EOF

kubectl apply -f grafana-agent.yaml
After the grafana-agent is deployed, it will collect the metrics and ingest them into the specified AMP workspace. Now deploy a sample application on the Amazon EKS cluster and start analyzing the metrics.
Deploy a sample application on the EKS cluster
To install an application and inject an envoy container, use the AppMesh controller for Kubernetes you created earlier. AWS App Mesh Controller for K8s manages App Mesh resources in your Kubernetes clusters. The controller is accompanied by CRDs that allow you to define App Mesh components, such as meshes and virtual nodes, using the Kubernetes API just as you define native Kubernetes objects, such as deployments and services. These custom resources map to App Mesh API objects that the controller manages for you. The controller watches these custom resources for changes and reflects those changes into the App Mesh API.
## Install the base application
git clone https://github.com/aws/aws-app-mesh-examples.git
kubectl apply -f aws-app-mesh-examples/examples/apps/djapp/1_base_application
kubectl get all -n prod      ## check the pod status and make sure it is running

NAME                            READY   STATUS    RESTARTS   AGE
pod/dj-cb77484d7-gx9vk          1/1     Running   0          6m8s
pod/jazz-v1-6b6b6dd4fc-xxj9s    1/1     Running   0          6m8s
pod/metal-v1-584b9ccd88-kj7kf   1/1     Running   0          6m8s


## Now install the App Mesh controller and meshify the deployment

kubectl apply -f aws-app-mesh-examples/examples/apps/djapp/2_meshed_application/
kubectl rollout restart deployment -n prod dj jazz-v1 metal-v1
kubectl get all -n prod     ## Now we should see two containers running in each pod

NAME                        READY   STATUS    RESTARTS   AGE
dj-7948b69dff-z6djf         2/2     Running   0          57s
jazz-v1-7cdc4fc4fc-wzc5d    2/2     Running   0          57s
metal-v1-7f499bb988-qtx7k   2/2     Running   0          57s


## generate the traffic for 5 mins and we will visualize it in grafana
dj_pod=`kubectl get pod -n prod --no-headers -l app=dj -o jsonpath='{.items[*].metadata.name}'`

loop_counter=0
while [ $loop_counter -le 300 ] ; do kubectl exec -n prod -it $dj_pod  -c dj  -- curl jazz.prod.svc.cluster.local:9080 ; echo ; loop_counter=$[$loop_counter+1] ; done
Create an AMG workspace
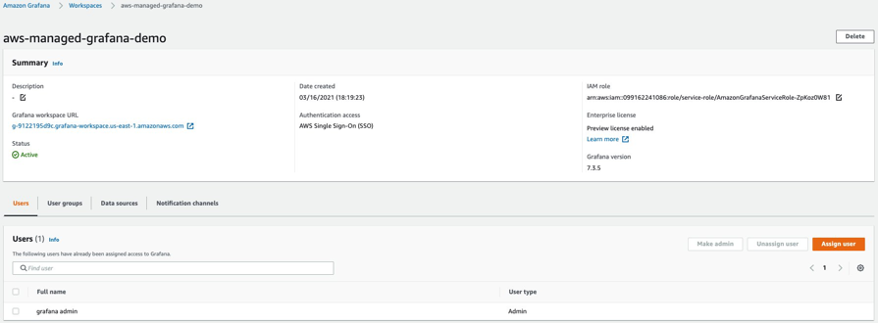
Creating an AMG workspace is straightforward. Follow the steps in the Getting Started with Amazon Managed Service for Grafana blog post. To grant users access to the dashboard, you must enable AWS SSO. After you create the workspace, you can assign access to the Grafana workspace to an individual user or a user group. By default, the user has a user type of viewer. Change the user type based on the user role. Add the AMP workspace as the data source and then start creating the dashboard.
In this example, the user name is grafana-admin and the user type is Admin. Select the required data source. Review the configuration, and then choose Create workspace.
Configure the data source and custom dashboard
To configure AMP as a data source, in the Data sources section, choose Configure in Grafana, which will launch a Grafana workspace in the browser. You can also manually launch the Grafana workspace URL in the browser. Use the instructions in the Getting Started with Amazon Managed Service for Grafana blog post and specify the AMP workspace you created earlier as a data source.


After the data source is configured, import a custom dashboard to analyze the envoy metrics. Choose Import (shown below), and then enter the ID 11022. This will import the Envoy Global dashboard so you can start analyzing the envoy metrics.


As you can see from the screenshots, you can view envoy metrics like downstream latency, connections, response code, and more. You can use the filters shown to drill down to the envoy metrics of a particular application.
Configure alerts on AMG
You can configure Grafana alerts when the metric increases beyond the intended threshold. With AMG, you can configure how often the alert must be evaluated in the dashboard and send the notification. Currently, AMG supports Amazon SNS, Opsgenie, Slack, PagerDuty, VictorOp notifier types. Before you create alert rules, you must create a notification channel.
In this example, configure Amazon SNS as a notification channel. The SNS topic must be prefixed with grafana for notifications to be successfully published to the topic.
Use the following command to create an SNS topic named grafana-notification and subscribe an email address.
aws sns create-topic --name grafana-notification

aws sns subscribe --topic-arn arn:aws:sns:<region>:<account-id>:grafana-notification --protocol email --notification-endpoint <email-id>
Add a new notification channel from the Grafana dashboard.

Configure the new notification channel named grafana-notification. For Type, use AWS SNS from the drop down. For Topic, use the ARN of the SNS topic you just created. For Auth provider, choose AWS SDK Default.


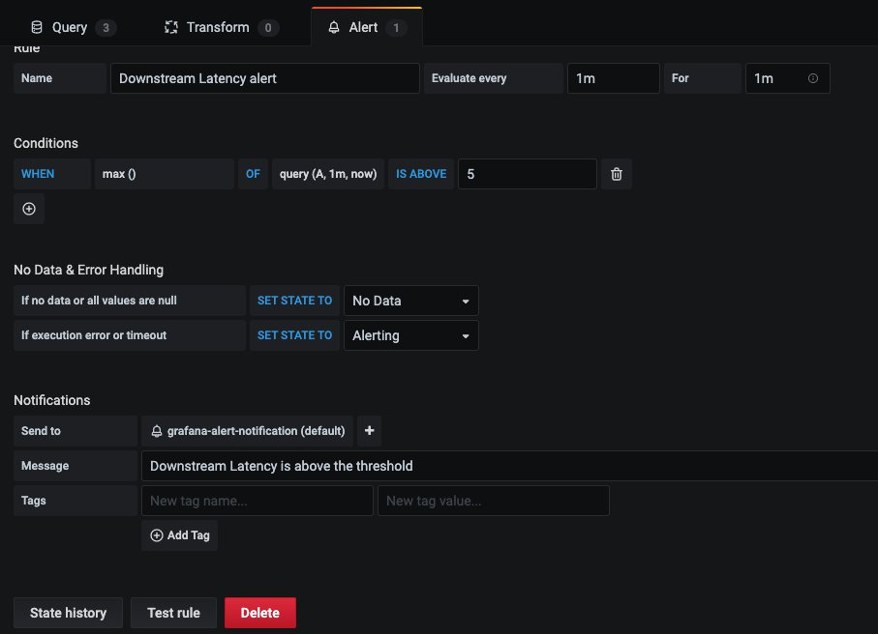
Now configure an alert if downstream latency exceeds five milliseconds in a one-minute period. In the dashboard, choose Downstream latency from the dropdown, and then choose Edit. On the Alert tab of the graph panel, configure how often the alert rule should be evaluated and the conditions that must be met for the alert to change state and initiate its notifications.
In the following configuration, an alert is created if the downstream latency exceeds the threshold and notification will be sent through the configured grafana-alert-notification channel to the SNS topic.

Conclusion
In summary, we’ve deployed an application running on EKS, integrated the app with AppMesh, scraped the Prometheus metrics using Grafana Agent to ingest the metrics to AMP and then visualize them in AMG. Because AMP and AMG are fully managed, serverless monitoring services, you can spend your time on the applications that transform your business and leave the job of managing the monitoring environment to AWS. AMP can be used with any Prometheus-compatible collectors such as a Prometheus server, ADOT, and Grafana Agent to collect metrics from other container environments such as Amazon ECS, self-managed Kubernetes on AWS, or on-premises infrastructure.
Further reading
- Using Amazon Managed Service for Prometheus to monitor EC2 environments
- Setting up cross-region metrics collection for Amazon Managed Prometheus workspaces
- Configuring Grafana Agent for Amazon Managed Service for Prometheus
- Setting up Grafana on EC2 to query metrics from Amazon Managed Service for Prometheus
- Using Service Meshes in AWS