AWS Cloud Operations & Migrations Blog
Monitoring hybrid environments using Amazon Managed Grafana
Setting up observability for workloads is critical to tracking application performance, reliability, and health. It’s even more important when you’re dealing with workloads that are deployed in hybrid environments.
A proliferation of monitoring tools can result in data silos or multiple single panes of glass. When an organization loses its consolidated view, whether it be across applications, teams, regions, or cloud environments, troubleshooting becomes increasingly difficult.
Customers often want a single-pane-of-glass solution that can pull data that resides in different silos, managed by different teams, and commissioned across different environments. They want that data to roll up the most important bits and surface out-of-the-ordinary behavior for speedy issue resolution and reliable service. Grafana, an open-source solution for running data analytics, pulls up metrics that make sense of the massive amount of data and monitors apps with the help of cool, customizable dashboards.
To help customers remove the heavy lifting of managing Grafana, AWS announced Amazon Managed Grafana during re:Invent 2020.
Based on the open source Grafana project, Amazon Managed Grafana manages the provisioning, setup, scaling, and maintenance of Grafana so that customers don’t have to do this themselves. Customers can use its built-in security features, including single sign-on, fine-grained data access control, and audit reporting, for compliance with governance requirements. Amazon Managed Grafana is integrated with AWS data sources that collect operational data, such as Amazon CloudWatch, Amazon Elasticsearch Service, Amazon Timestream, AWS IoT SiteWise, AWS X-Ray, Amazon Managed Service for Prometheus (AMP) and also integrates with Azure Monitor and Google Cloud Operations, offering developers, operators and reliability engineers a single set of operational focal point across all cloud services. With Amazon Managed Grafana you can define dashboards that gives you end to end visibility into your applications, regardless whether they are running on premise and monitored by Prometheus or running on a public cloud service. This minimizes data export from the native cloud tools while eliminating tool fatigue, creating a single point for operational visibility and alerts.
In this blog post, I’ll walk you through the steps to visualize metrics from an Azure Cloud environment to Amazon Managed Grafana and create alert notifications in Amazon Managed Grafana to be sent to Amazon Simple Notification Service (Amazon SNS) and Slack.
As a part of implementing the solution, you will:
- Create an Amazon Managed Grafana workspace.
- Configure the Azure Monitor plugin as the data source for Amazon Managed Grafana and configure the Grafana dashboard.
- Create two notification channels: one for Amazon SNS and one for Slack.
- Configure alerts in the Amazon Managed Grafana dashboard to be sent to the notification channels.
Prerequisites
Before you begin, you need the following:
- AWS CLI version 2
- To grant users access to the dashboard, you must enable AWS Single Sign-On (AWS SSO) in your account. For instructions, see Enable AWS SSO in the AWS Single Sign-On User Guide.
- An Azure account.
Create an Amazon Managed Grafana workspace
First, create an Amazon Managed Grafana workspace to visualize the metrics from Azure Monitor. Follow the steps in the Getting Started with Amazon Managed Grafana blog post. After you create the workspace, you can assign access to the Grafana workspace to an individual user or a user group. By default, the user has a user type of viewer. Change the user type based on the user role.
Note: You must assign an Admin role to at least one user in the workspace.
In Figure 1, the user name is grafana-admin. The user type is Admin. On the Data sources tab, choose the required data source. Review the configuration, and then choose Create workspace.

Figure 1: azure-monitor-grafana-demo
Configure the data source and custom dashboard
Now, under Data sources, configure the Azure Monitor plugin to start querying and visualizing the metrics from the Azure environment. Choose Data sources to add a data source.
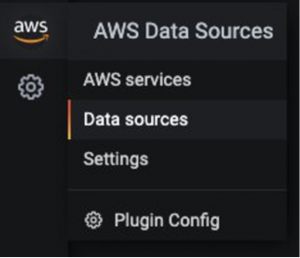
Figure 2: Data sources
In Add data source, search for Azure Monitor and then configure the parameters from the app registration console in the Azure environment.
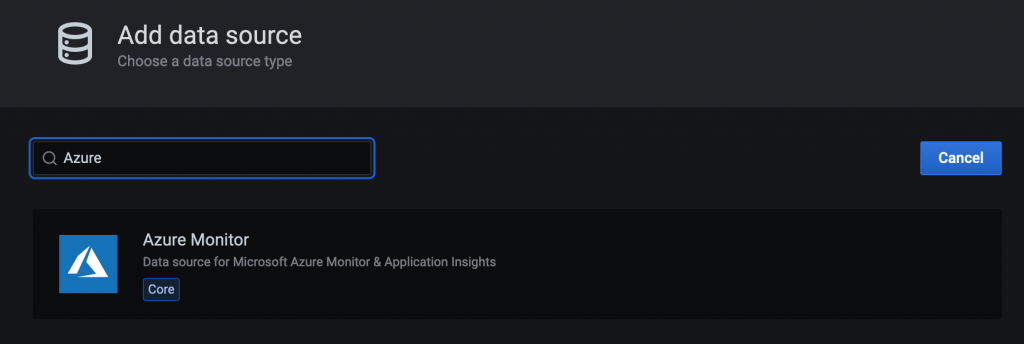
Figure 3: Add data source
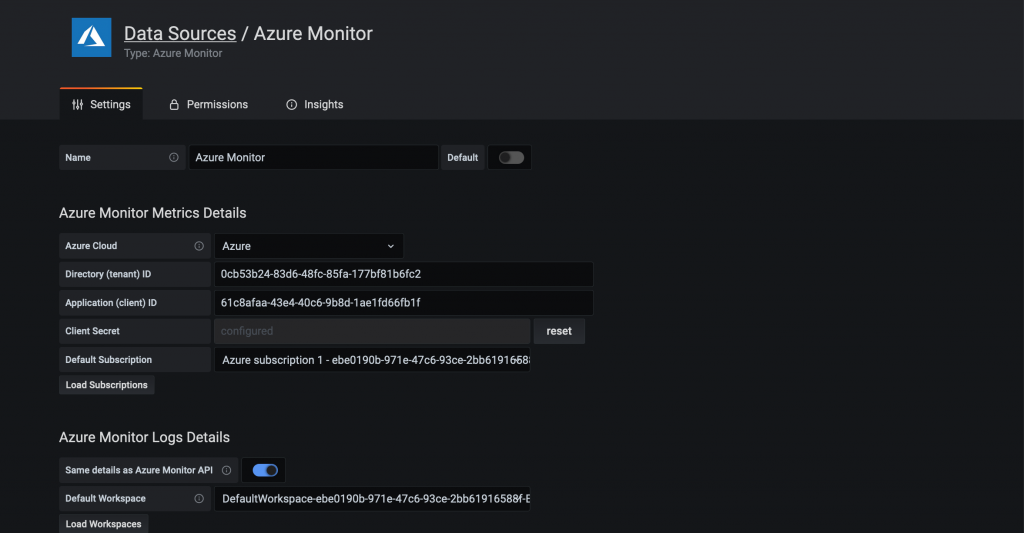
Figure 4: Azure Monitor metrics details
To configure the Azure Monitor plugin, you need the directory (tenant) ID and the application (client) ID. For instructions, see the article about creating an Azure AD application and service principal. It explains how to register the app and grant access to Grafana to query the data.
After the data source is configured, import a custom dashboard to analyze the Azure metrics. In the left pane, choose the + icon, and then choose Import.
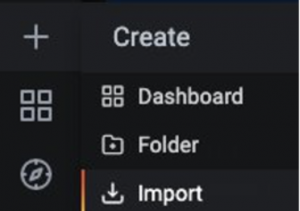
Figure 5: Import
In Import via grafana.com, enter the dashboard ID, 10532.
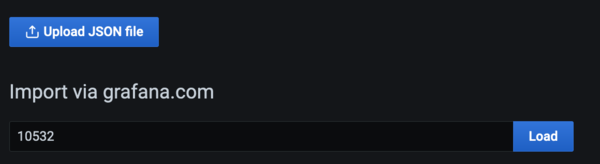
Figure 6: Import ID 10532
This will import the Azure Virtual Machine dashboard where you can start analyzing the Azure Monitor metrics. In my setup, I have a virtual machine running in the Azure environment.
Figure 7 shows the dashboard:
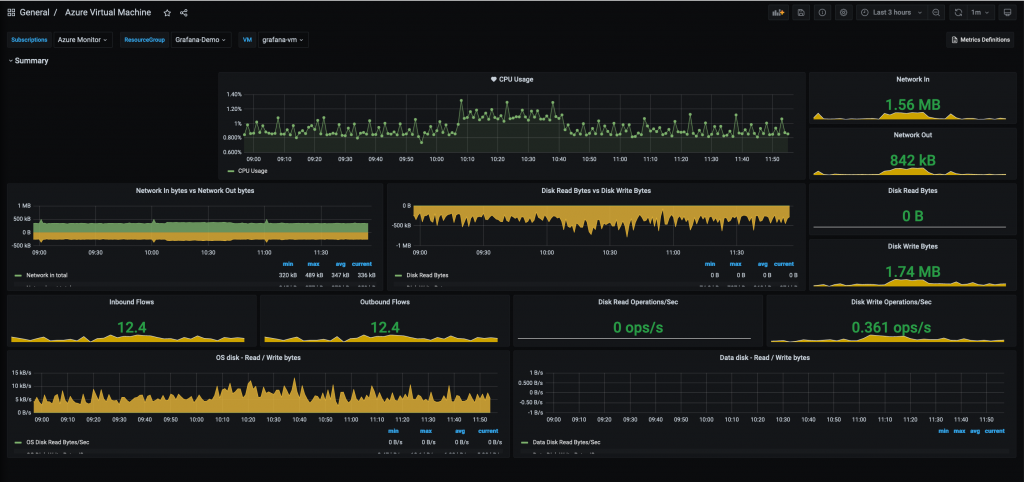
Figure 7: Dashboard
Configure the notification channels on Amazon Managed Grafana
In this section, you’ll configure two notifications channels and then send alerts.
SNS notification channel
Use the following command to create an SNS topic named grafana-notification and subscribe an email address.
aws sns create-topic --name grafana-notification
aws sns subscribe --topic-arn arn:aws:sns:<region>:<account-id>:grafana-notification --protocol email --notification-endpoint <email-id>
In the left pane, choose the bell icon to add a new notification channel.
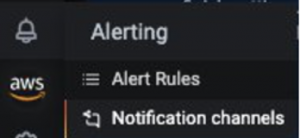
Figure 8: Notification channels
Now configure the grafana-notification notification channel. On Edit notification channel, for Type, choose AWS SNS. For Topic, use the ARN of the SNS topic you just created. For Auth Provider, choose the workspace IAM role.

Figure 9: Edit notification channel
You have now set up the SNS notification channel and are ready to create the Slack notification channel.
Slack notification channel
To configure a Slack notification channel, create a Slack workspace or use an existing one. Enable Incoming Webhooks as described in Sending messages using Incoming Webhooks.
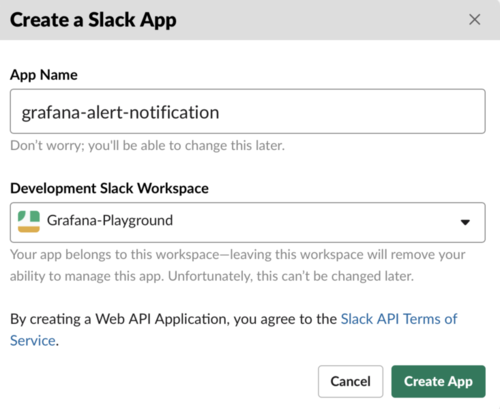
Figure 10: Create a Slack App
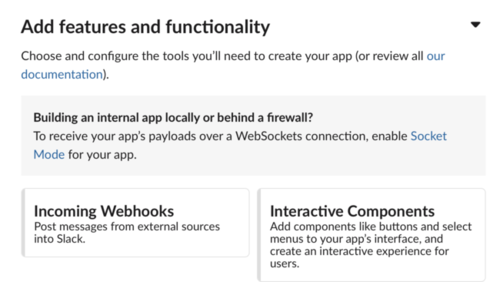
Figure 11: Add features and functionality
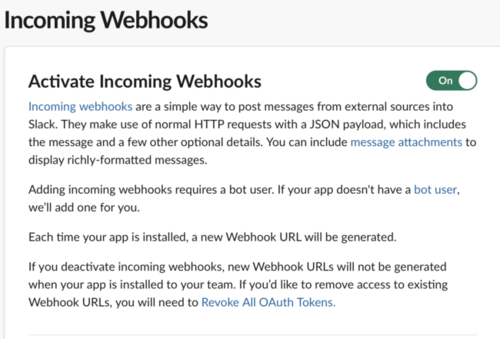
Figure 12: Activate Incoming Webhooks
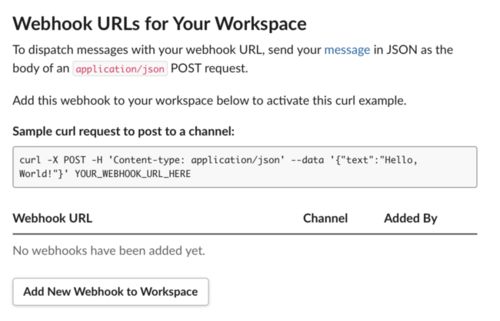
Figure 13: Webhook URLs for Your Workspace
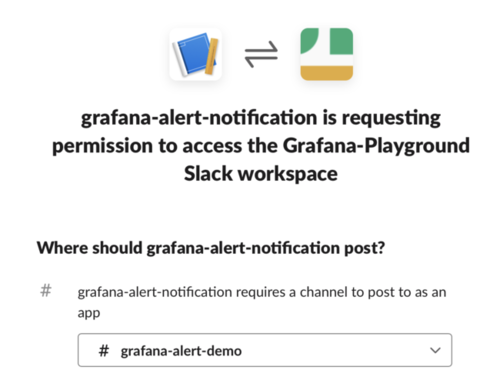
Figure 14: Request for permission to access the Slack workspace
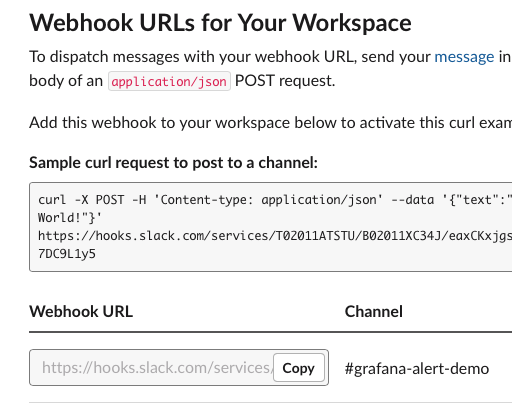
Figure 15: Webhook URLs for Your Workspace
After you’ve configured the workspace, you should be able to get a webhook URL that will be used in the Grafana dashboard.
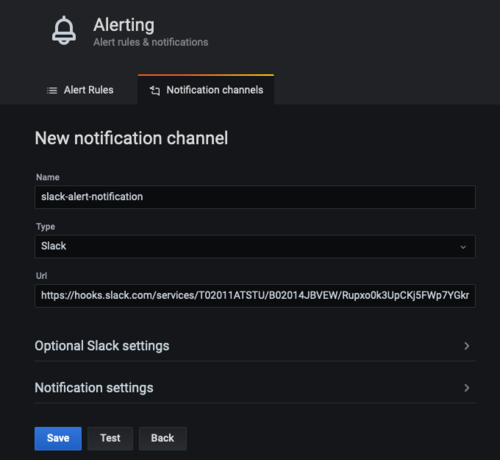
Figure 16: New notification channel
Configure alerts in Amazon Managed Grafana
You can configure Grafana alerts when the metric increases beyond the threshold. With Amazon Managed Grafana, you can configure how often the alert must be evaluated in the dashboard and send the notification. In this example, configure an alert for CPU utilization for an Azure virtual machine. When the utilization exceeds a threshold, configure Amazon Managed Grafana to send notifications to both channels.
In the dashboard, choose CPU utilization from the dropdown, and then choose Edit. On the Alert tab of the graph panel, configure how often the alert rule should be evaluated and the conditions that must be met for the alert to change state and initiate its notifications.
In the following configuration, an alert is created if the CPU utilization exceeds 50%. Notifications will be sent to the grafana-alert-notification and slack-alert-notification channels.

Figure 17: Azure Virtual Machine Edit Panel
Now, you can sign in to the Azure virtual machine and initiate stress testing using tools like stress. When the CPU utilization exceeds the threshold, you will receive notifications on both channels.
Now configure alerts for CPU utilization with the right threshold to simulate an alert that is sent to the Slack channel.

Figure 18: CPU Usage
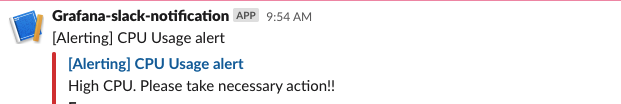
Figure 19: Grafana-slack-notification
Conclusion
In this blog post, I showed you how to deploy the Amazon Managed Grafana workspace, configure notification channels, collect metrics from Azure Cloud, and configure alerts on the Amazon Managed Grafana dashboard. Because Amazon Managed Grafana is a fully managed, serverless solution, you can spend your time on the applications that transform your business and leave the heavy lifting of managing Grafana to AWS.
Further reading
- Amazon Managed Grafana preview updated with new capabilities
- Setting up Grafana on EC2 to query metrics from Amazon Managed Service for Prometheus