AWS Database Blog
Near real-time processing with Amazon Kinesis, Amazon Timestream, and Grafana
August 30, 2023: Amazon Kinesis Data Analytics has been renamed to Amazon Managed Service for Apache Flink. Read the announcement in the AWS News Blog and learn more.
As organizations adopt and deploy home-connected smart devices, they face challenges utilizing device telemetry data in narrow and broad contexts. Examples of such home-connected devices are smart meters and home sensors that emit telemetry and measurements as time series data. In a narrow context, operational teams use data to understand if devices are operating within defined parameters and conditions. In a broader context, business analytics teams want to identify new business opportunities and provide value added services in the form of an optimized customer experience. Examples of such use cases include anomaly detection and personalized offerings and forecasts using machine learning (ML) insights. To broaden the context of data, the telemetry data is joined with additional data sources that reside in data lakes or other data stores.
We often hear the question from our customers on how to set up pipelines that enable internet of things (IoT) time series data analytics in both contexts. In a previous post, we surveyed patterns to ingest data into an Amazon Timestream database using architectures for data processing. Amazon Timestream serves as a fully managed, purpose-built time series database to store and analyze time series data at scale. We also explored some of those patterns tackling the challenges of late-arriving data and jitter by performing upserts and normalizing jitter while visualizing data for analytical insights.
In this post, we dive deeper into the ingestion patterns and pipelines architectures supporting analytics. We address the challenges for operational and insights analytical consumptions patterns with an example use case.
Solution overview
For operational monitoring, you need to handle out-of-sync data due to an IoT device internal clock or daylight savings errors. This often leads to device data with timestamps more than 15 minutes in the future. For ML insights and analytics, you need to join streamed IoT data with historical device telemetry data and other data stored in your organization’s data lake.
To address these challenges, we walk you through setting up a serverless pipeline architecture that streams, processes, and visualizes time series events.
We first show how to monitor your devices’ operations by visualizing operational data with Grafana, and utilizing the scalability of Timestream for near-real-time analytics. This part of the pipeline allows you to monitor the operational performance of your devices. Here the pipeline uses preprocessing to clean the data to handle out-of-sync events.
We also explore how you can extend this pipeline to store raw data in your data lake, like the one you can set up with the AWS Meter Data Analytics Quick Start. This enables a different perspective on device data and joining other data sources, like reference data, for ML powered insights.
Code samples for this post and the pipeline setup are found in the samples GitHub repository.
Architecture overview
The use case of our architecture deals with telemetry data from connected devices. Opting for a serverless architecture allows you to scale in cost-efficient manner and pay only for resources used while simplifying management overheads.
The following diagram shows our ingestion and consumption components.
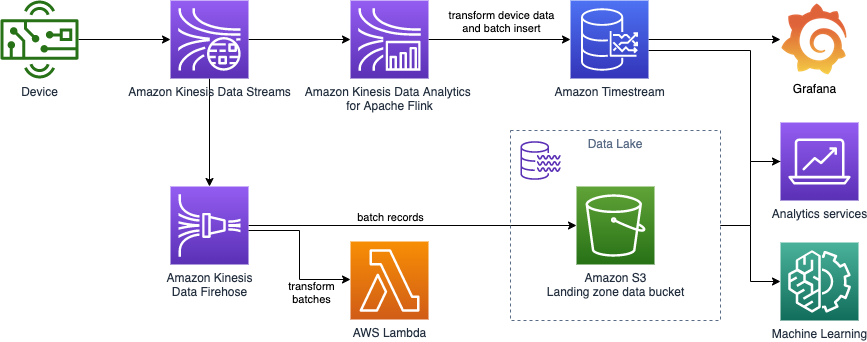
We use Timestream as a scalable serverless time series database for IoT and operational events ingestion and querying. Timestream allows you to configure different retention periods for your tables to optimize storage costs while allowing querying data across the different storage tiers. Its purpose-built query engine transparently accesses and combines data across storage tiers without you having to specify the data location.
Amazon Kinesis Data Streams is a scalable and durable data streaming service and a message medium for transporting streaming events. Multiple consumers are used for different patterns of consumption like operational monitoring and extending raw data to your data lake.
As devices send data in various formats optimized for transportation, an Amazon Kinesis Data Analytics for Apache Flink application transforms and aggregates streaming data in near-real time, then ingests events into Timestream database. We use the Kinesis Data Analytics application to detect and clean any errors in time series data timestamps before ingesting them in Timestream to optimize operational analytics.
Amazon Kinesis Data Firehose extends data from Kinesis Data Streams to your data lake stored in Amazon Simple Storage Service (Amazon S3).
Finally, data is visualized directly from the Timestream database by a Grafana dashboard using the Timestream datasource plugin and Amazon QuickSight.
Data ingestion pipeline
Moving data from one point to the other is never the main goal, it is rather a necessary component that enables data consumption by different stakeholders. It would be necessary then to understand the goals of our pipelines before rushing into building them. The operational teams’ goal is to understand what’s happening with the deployed devices as soon as data is ingested. The operational teams can inspect various device metrics and deploy models that help them understand if they need to react on certain trends as they are happening. This goal sheds light then on the near-real-time analytics and working with unclean operational data requirements. On the other hand, the business teams’ goal is to use the device data to enrich their perspective on the device customers 360-degree perspective. This implies that the data needs to be joined with external non-timeseries data sources but not in the same immediacy constraints set by operational teams.
The goal then is to build a flexible pipeline that enables you to mitigate issues with device data in near-real-time and extend data to your data lake. In the next sections we dive deeper into the data pipeline to understand how you can achieve this goal.
Kinesis Data Streams for time series data streaming
First let’s examine the IoT devices’ operational conditions. Devices face many connectivity challenges, such as connection stability. Challenges are amplified as multiple devices in the same network compete for resources. In low connectivity scenarios, devices can buffer messages and deliver them in bulk when the device is online again.
Another challenge is that device clocks can go out of sync. In such scenarios, devices produce timestamps that are inaccurate, such as reflecting points of time in the future. Although it’s desirable to clean data of jitters and errors, original data granularity (including errors and jitters) is needed for ML use cases and anomaly detections.
Given that, not every connected device situation is the same, and as devices get more complex, devices can accommodate data aggregation and jitter cleansing at the edge before streaming events to the cloud. If you can guarantee a reasonable data quality from your devices, you can ingest data directly in a scalable and reliable manner to Timestream through the AWS APIs and SDK. In situations where clients are better suited to communicating in MQTT and the MQTT over WebSocket Secure (WSS), you can also use AWS IoT Core rules to ingest data.
In other scenarios where devices lack the computation power and logic, Kinesis Data Streams allows a reliable streaming ingestion mechanism. Streaming pipelines with near-real-time processing accommodate out-of-sync events and enable event flow to multiple consumers, like Timestream and a data lake to store events in raw format.
Device simulator to produce time series data
To simulate devices, an AWS Lambda function produces and pushes events to Kinesis Data Streams.
The events streamed contain information similar to the following sample from multiple devices.
| DeviceID | Timestamp | temperature | humidity | voltage | watt |
| 12345678-9012-3456-7890-123456789012 | 2021-12-13 11:59:48.1234567 | 11.2 | 33.4 | 55.6 | 777.88 |
The following diagram illustrates a connected device streaming data.
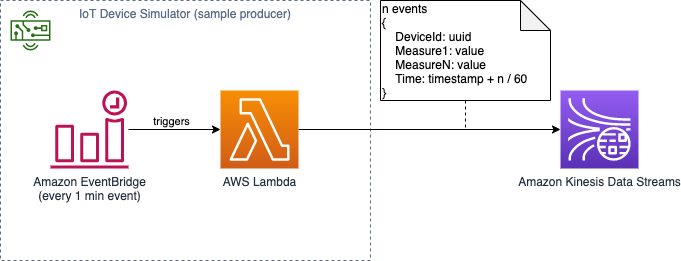
The preceding example data is generated from the Lambda device simulator and produces the following JSON data:
The Lambda function simulates sending a continuous stream of events covering timespans in bursts the same way an IoT device would. You can also configure the behavior of the producer, including chances of introducing anomaly values.
Then, an Amazon EventBridge rule periodically invokes the Lambda function with a parameter specifying the data stream to publish events to. See the following code:
Although the described architecture simulates data producers, in reality you can use AWS IoT Greengrass, an open-source IoT edge runtime and cloud service, to stream data directly to Kinesis Data Streams.
Timestream database as an IoT events data store
Now let’s look at the data store that powers our near-real-time operational analytics.
The following table shows how the example data is modeled in Timestream.
| DeviceID (Dimension) | measure_value::double | measure_name | measure_type | time |
| 12345678-9012-3456-7890-123456789012 | 11.2 | temperature | DOUBLE | 2021-12-13 11:59:48.1234567 |
| 12345678-9012-3456-7890-123456789012 | 33.4 | Humidity | DOUBLE | 2021-12-13 11:59:48.1234567 |
| 12345678-9012-3456-7890-123456789012 | 55.6 | Voltage | DOUBLE | 2021-12-13 11:59:48.1234567 |
| 12345678-9012-3456-7890-123456789012 | 777.88 | Watt | DOUBLE | 2021-12-13 11:59:48.1234567 |
To map the data to the Timestream model, every device measure in the message is mapped to multiple rows. For each row, Device ID is considered as metadata and is mapped as a dimension. The telemetry measure names that are emitted by the device are mapped as measure_name. The value of the measure is mapped to the measure_value. Finally, the measure_type field is set as double in this case for all measurements, but you can use other measure types for your data. Review the best practices on mapping and data modeling for insights on mapping your device data.
In our example repository, we use sample retention values for memory and magnetic stores based on expected query patterns. You can set the values that work best for the expected event delays, query patterns from dashboards, and your organization data retention policies. For best practices on data retention, review the following best practices guide.
Kinesis Data Analytics for near-real-time events preprocessing
Now that you’ve learned about the ingestion pipeline and the IoT events data store, let’s check the events preprocessing component of the architecture that connects them. The Kinesis Data Analytics for Apache Flink application is one consumer for the data stream that preprocesses and ingests data into Timestream. We use another consumer to extend the events without any manipulation to the data lake, as we show in an upcoming section.
The example preprocessing implementation retrieves IoT events and does the following:
- Maps events to a Timestream record
- Preprocesses events to check for out-of-sync events
- Buffers and inserts events to the created Timestream table
You can use the same pattern to ingest events into Timestream from other streaming services like Amazon Managed Streaming for Apache Kafka (Amazon MSK).
Kinesis Data Analytics for Apache Flink application anatomy
Flink applications deployed in Kinesis Data Analytics are packaged as Java JAR files. This allows the flexibility to use languages that target JVM for application authoring. In this example, we show an application using the Kotlin Gradle build framework. We continue to use snippets from this application in the examples. Our samples repository also supplies a Java-based application for reference.
Let’s dive deeper into our main logical components of the Flink application:
- The application uses the
flink-connector-kinesislibrary to consume the data stream:
- The mapper creates multiple records, as described in the Timestream model, from the transport model used by devices that combines multiple telemetry in one event. It doesn’t introduce any logical or sanity checks on the transformations; this is the job of processors down the line in the stream process. See the following code:
- Next, we detect out-of-sync events and auto-correct the events’ timestamp to the ingestion timestamp. We implement a processor that filters Timestream records whose timestamps are in the future beyond the allowed lead value by Timestream ingestion APIs. Because the telemetry in these endpoints is important in our use case and needs to be ingested, we assume based on our knowledge of device architectures that such events’ timestamps can be corrected to the ingestion timestamp. Such tampering with data happens in this consumer for the streaming architecture and doesn’t change the original events stream. The unmodified events can still be ingested by different consumers, as we describe in the extension to data lake section. See the following code:
- The final piece in our application consumption stream is to add a sink that does efficient records ingestion in the Timestream database (see the following code). The sink buffers records to utilize batch ingestion APIs. For additional optimizations to scale efficient ingestion, see Writing batches of records with common attributes.
- After we define all the logical components, we add them to a stream pipeline in the Flink application:
To build and package the application, we use Gradle via the Gradle wrapper. The following code is an example of the Gradle Kotlin build script in build.gradle.kts:
For details on how to produce the JAR artifact, see the instructions in the samples repository. The AWS Cloud Development Kit (AWS CDK) application then deploys the packaged artifact in the Kinesis Data Analytics for Apache Flink application.
IAM role for the analytics application
An AWS Identity and Access Management (IAM) role is attached to the application, which needs permissions to allow the application to read events to the data stream and write to the Timestream database table.
The following code is an example policy that grants such permissions. Make sure to replace the sample account ID (1111122223333) and Region (<region>) placeholders.
Extend events to the data lake with Kinesis Data Firehose
Kinesis Data Firehose is designed to scale the delivery of streaming data to non-streaming stores in a reliable fashion. In this post, we show how to utilize transformation features to make JSON data accessible for consumption by big data analytical services in JSON Lines format.
Because the event producers already produce JSON records, we need a Lambda function to act as a transformation function and add a new line delimiter between records. You don’t need to create the function from scratch; you can create a function from the Lambda blueprints.
The following is an example for a Python 3.8 Lambda function code to add a new line after every record:
After you create the transformation Lambda function, you can create a Kinesis Data Firehose delivery stream. The delivery stream acts as a second consumer to the Kinesis data stream with additional transformation configuration. For more information on optimizing the delivery format for analytics services, see Amazon Kinesis Data Firehose custom prefixes for Amazon S3 objects.
The following screenshot is an example of the Firehose delivery stream configuration with a transformation function.

The following screenshot shows the delivery stream’s Amazon S3 destination settings.
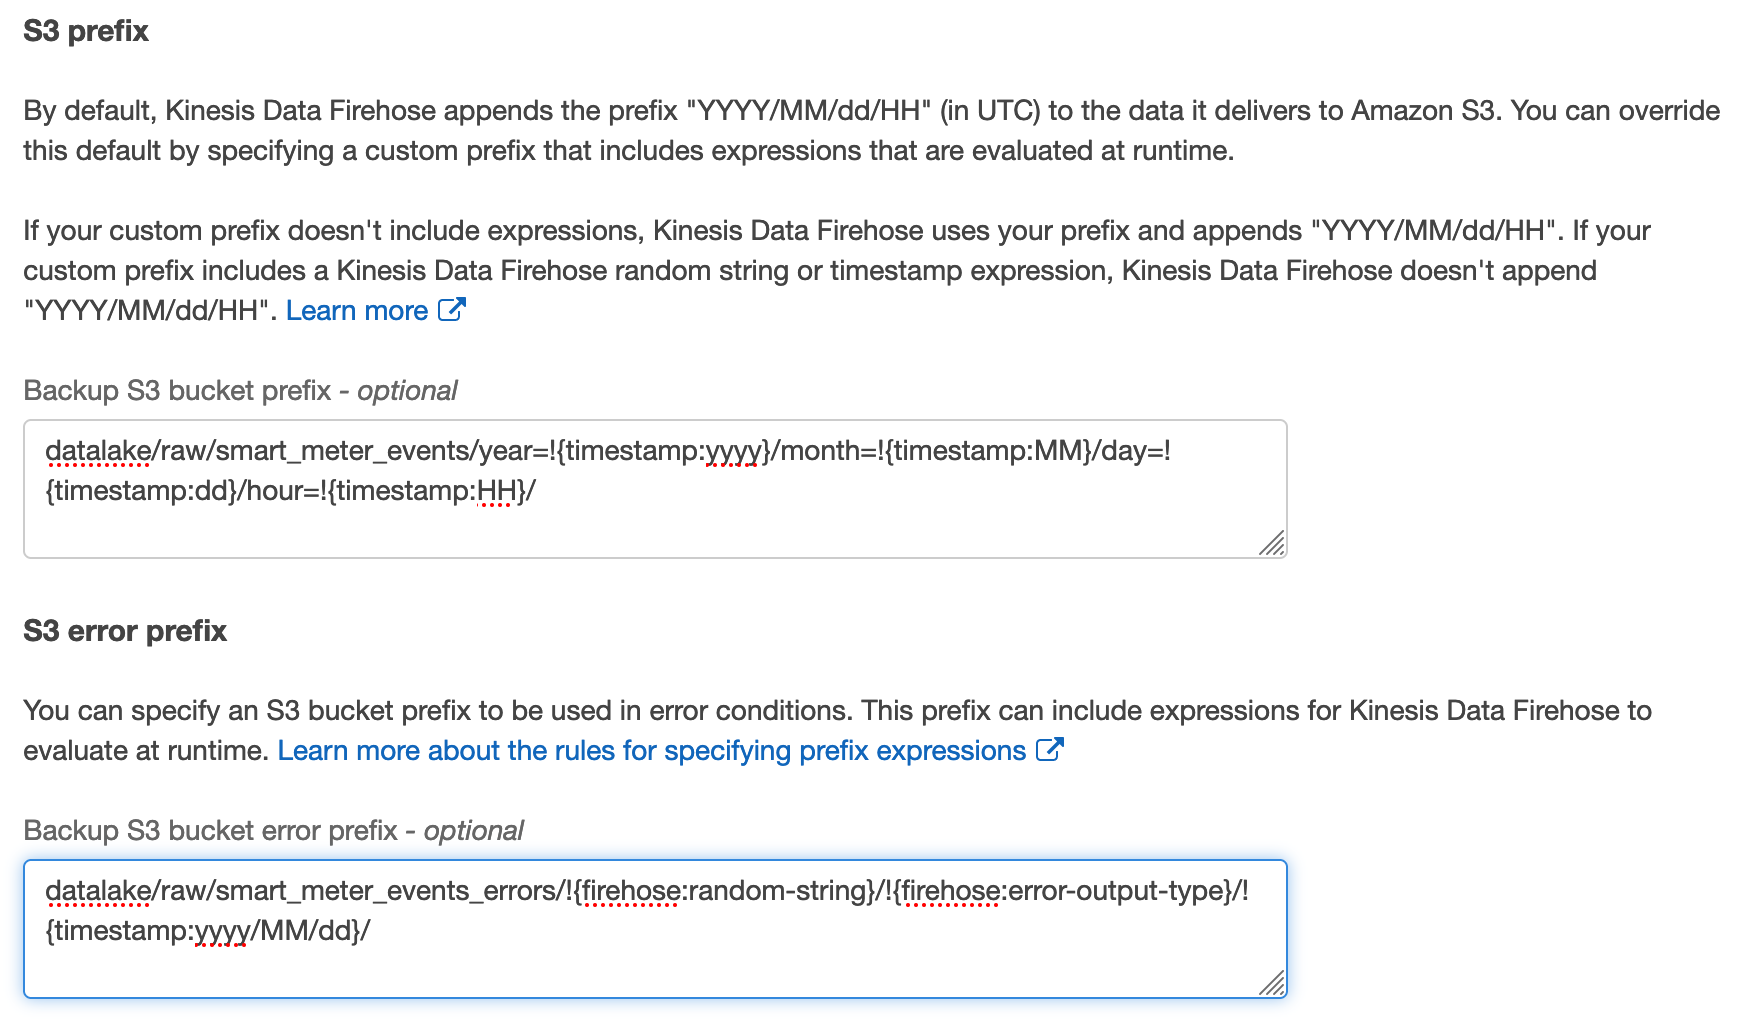
After you start the delivery stream, records are buffered and delivered to Amazon S3 as they’re ingested in the data stream. As a result, you can now discover and query data through AWS analytics services. For more information on querying JSON data with Amazon Athena, see Querying JSON.
Consumption analytics and visualizations
Now we can compare and contrast ways to get business and operational insights from your data in different contexts. While QuickSight provides business intelligence and ML analytical insights, Grafana provides operational near-real-time monitoring for IoT edge device data. Each has their unique strengths and when combined you enable your teams to have holistic view from your data.
Operational monitoring and visualizations with Grafana
The quickest way to get started with Grafana is through Amazon Managed Service for Grafana (AMG), which comes with a Timestream plugin. If you prefer to manage your own instance, the samples repository stack installs a serverless container-based Grafana instance. The Grafana container needs IAM permissions to read from the Timestream databases and tables. In the sample AWS CDK stack, we add such permissions; see the following code:
The instance installs the Timestream Grafana plugin on container startup. If you want to install the Timestream datasource plugin using the grafana-cli on other instances that you already have, use the following command:
Visualization
The AWS CDK stack sets up the data source and dashboard automatically in the Grafana instance. A full dashboard JSON can be found in the following GitHub repository. The dashboard has two variables defined: device_id and measure. The following screenshot is an example for a panel that inspects a single measurement of a given device. As you change the parameters, queries are run on the Timestream database to visualize device telemetry. Timeseries functions allow operational monitoring with a variety of aggregation queries over time windows through queries directly performed by the Timeseries database.
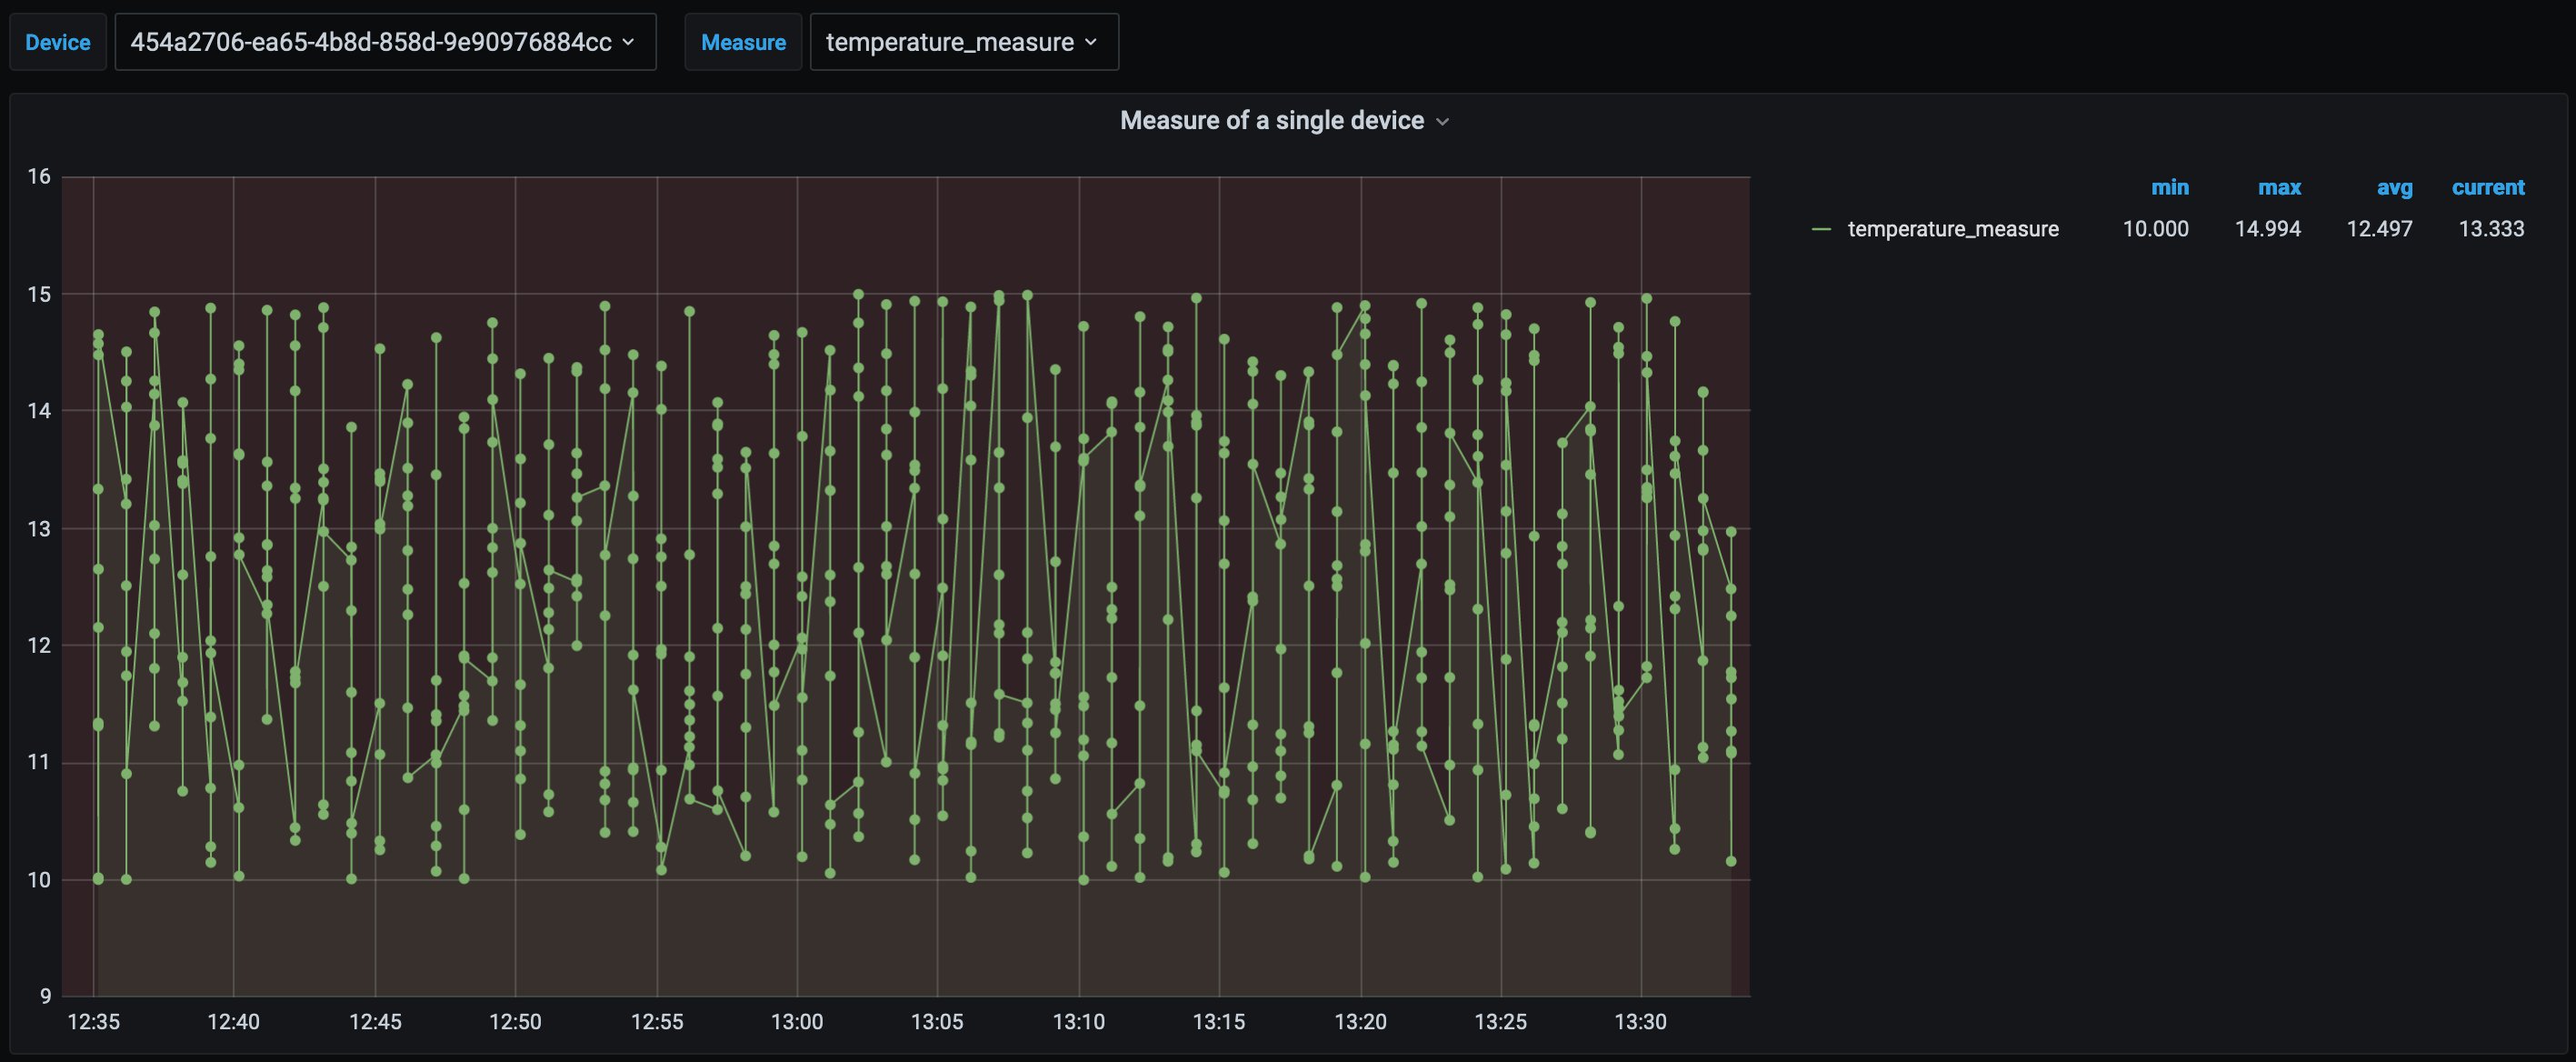
If we inspect the query, we can see where the measure and device variables are used inside the query:
Analytics intelligence with analytics services
You can directly connect Timestream to QuickSight to aggregate time series data over time spans and device dimensions. This way, you can use Timestream scalability and query performance to directly query your data.
To broaden your data context further, you can join IoT raw data (now in your data lake) with other datasets. For example, you can use device location data stored in your data lake for infrastructure coverage optimization use cases. Let’s join device IoT measurements data with a device location dataset using geospatial functions for aggregations.
The following code is an example query that you can run in Athena:
You can use your data lake as a data source for QuickSight to visualize the preceding query to gain insights on infrastructure needs based on operational devices’ locations.

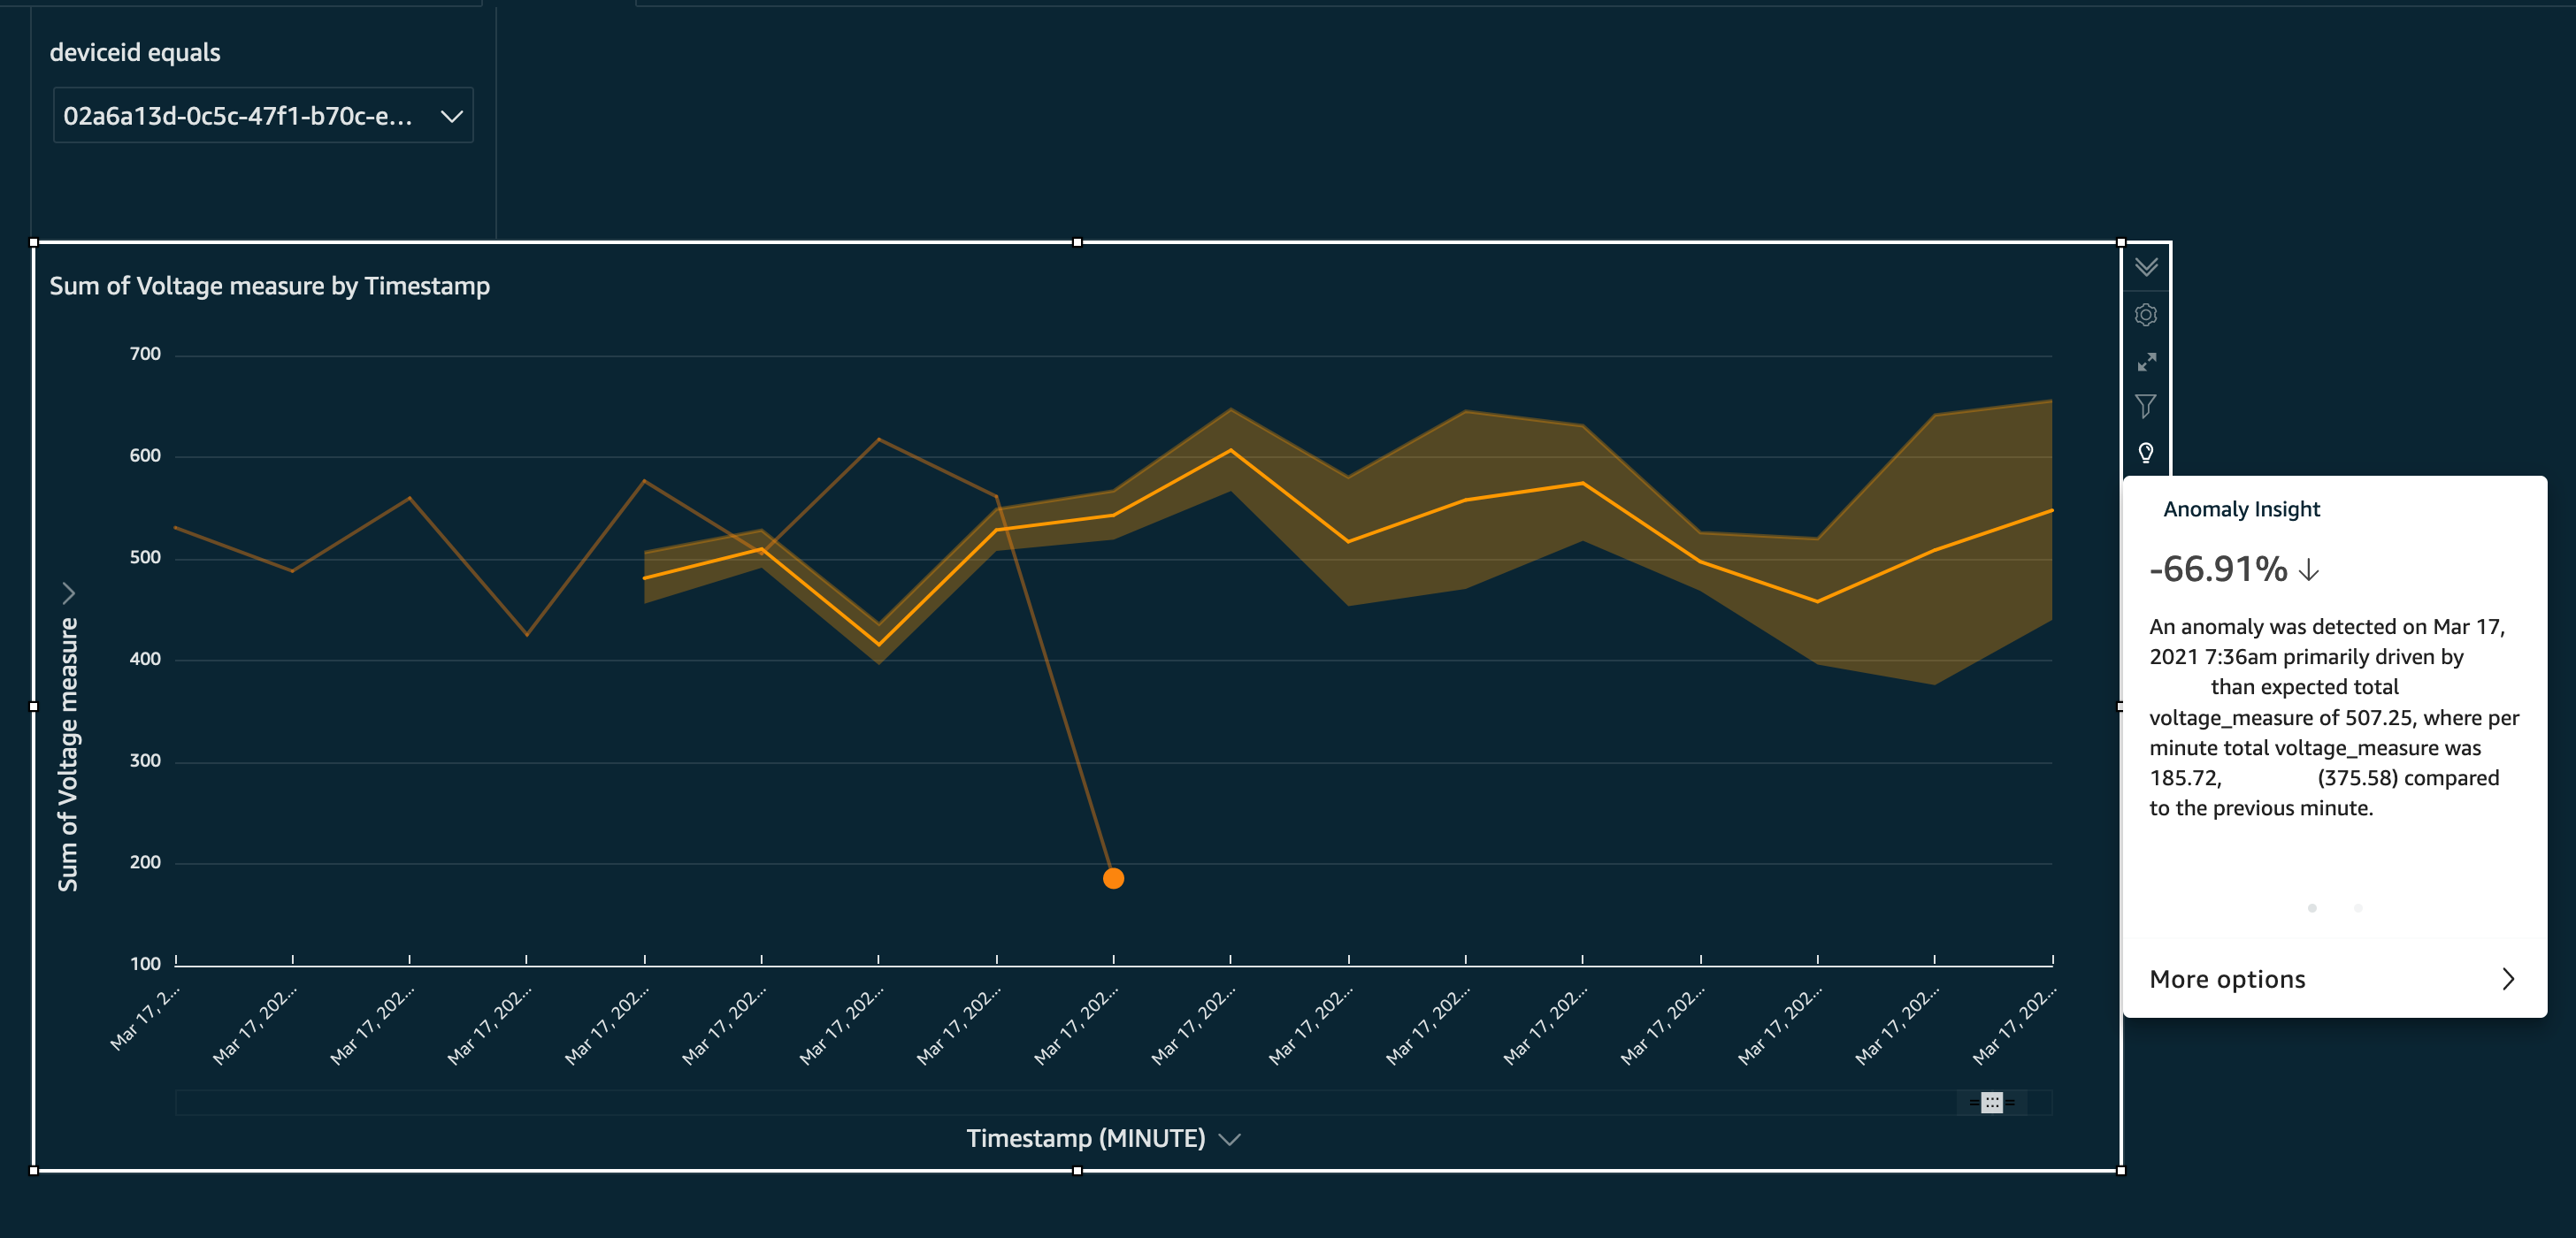
Additionally, ML-based insights can help you and your customers understand their service consumption. By projecting consumptions in the future, you can use projections to power personalized business plans recommendations use cases. You can also use ML-identified anomalies of a baseline consumption to notify your customers and power customer-automated advisor use cases. ML insights benefit from additional context added to device data like device location or device owner demographics.
By establishing a baseline for a measure value, ML insights now can detect if a certain data point is not within the established baseline. The baseline represents normal usage pattern. Bear in mind that anomaly data points are detected even if they lie within limits of operational safety. Anomaly data points are highlighted though because they don’t conform to baseline usage patterns. This is presented as a solid dot in the following visualization. Additionally, a forecast for data points value in future periods can be predicted within a degree of confidence. This is represented in the following visualization as a bolder line, within a region that represents upper and lower bounds.
Clean up
To avoid additional charges, follow the cleanup guide to tear down the resource stacks you created. If you extended data to your data lake, you pay for storage costs unless you delete the data from Amazon S3.
Conclusion
This post is a part of series of posts that aim to explore various patterns for data ingestion and cost-effective architecture pipelines. These pipelines provide analytical and operational insights of your time series data. With these architectures, you can build a data hub linking your customer and data stakeholders in your organization to expand the uses cases you can deliver to them.
We’ve shown how to set up a serverless streaming pipeline to process and store your device telemetry IoT data into a time series optimized data store, Timestream. This gives your operational teams the insights they need to perform operational monitoring. We also connected Grafana to the Timestream database to visualize the metrics in an operational near-real-time dashboard.
We then showed how to extend your data back to your data lake. This way, you combine telemetry data with additional data sources for ML-powered analytical insights.
The full source code and AWS CDK scripts for the pipeline can be found in the GitHub repository.
We’re curious to know how you use IoT data in different analytical contexts, let us know in the comments your thoughts.
About the Authors
 John Mousa is a Solutions Architect at AWS. He helps power and utilities and healthcare and life sciences customers as part of the regulated industries team in Germany. John has interest in the areas of service integration, microservices architectures, as well as analytics and data lakes. Outside of work, he loves to spend time with his family and play video games.
 Sascha Janssen is a Solutions Architect at AWS based in Germany. He works with Power & Utility customers to help them on their journey to the cloud. Together with his customers he likes to build serverless solutions, connect ‘things’ and use the data to deliver deeper insights.