OpenTelemetry Collector is a stand-alone service provided by OpenTelemetry. It can be used as a telemetry-processing system with a lot of flexible configurations to collect and manage telemetry data. Let's do a deep dive on OpenTelemetry Collectors to understand how it works.
The first step in setting up observability with OpenTelemetry is instrumentation. The application code is instrumented with OpenTelemetry client libraries that help generate telemetry data like logs, metrics, and traces.
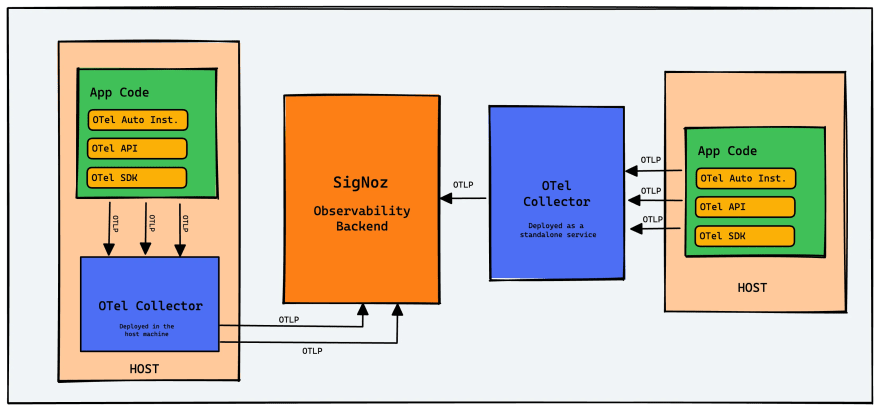
Once the telemetry data is generated, it can be exported directly to an observability backend or an OpenTelemetry Collector. The collector provides a vendor-neutral way to collect, process, and export your telemetry data(logs, metrics, and traces), and that’s why it is preferable to use a collector. The biggest advantage of using OpenTelemetry collectors is the flexibility to create different data pipelines.
OpenTelemetry collectors can be deployed in different ways. It can be deployed on each host machine as an agent. When the collector is deployed on host machines, you can directly collect host metrics like CPU usage, RAM, disk I/O metrics, etc.
You can also run your OpenTelemetry Collector as a stand-alone service. The client libraries of OpenTelemetry have an exporter that can be configured to send the telemetry data to the collector. Usually, a mixed pattern of OpenTelemetry Collectors is recommended to handle scale.
Before deep-diving into OpenTelemetry collectors, let's take a short detour to understand what OpenTelemetry is.
What is OpenTelemetry?
OpenTelemetry is an open-source observability framework that aims to standardize the generation, collection, and management of telemetry data(Logs, metrics, and traces). It is incubated under Cloud Native Computing Foundation(CNCF), the same foundation which incubated Kubernetes.
OpenTelemetry follows a specification-driven development and provides client libraries to instrument applications in most programming languages. Once you have instrumented with OpenTelemetry, you should be able to collect various telemetry signals like logs, metrics, and traces from it. And that's where OpenTelemetry Collector comes into the picture.
Why to use OpenTelemetry Collector?
An OpenTelemetry collector has three main functions - collect, process, and export the telemetry data collected. Let us first understand why it is a critical component of your observability architecture.
OpenTelemetry Collector gives you the flexibility to handle multiple data formats and offloads responsibility from the application to manage telemetry data.
List of reasons why to use OpenTelemetry Collector:
- It provides a vendor-agnostic way to collect telemetry data.
- The Collector offloads responsibility from the application to manage telemetry data, thereby reducing overhead and providing separate concerns from the application for any telemetry configuration.
- Using OpenTelemetry Collector, you can export telemetry data in multiple formats to multiple observability vendors of your choice.
- It enables quick config-based updates to your telemetry data pipeline. It is trivial to update a config file to receive data in another format.
- It can also help collect host metrics such as RAM, CPU, and storage capacity.
Architecture of OpenTelemetry collector
OpenTelemetry collector consists of three main components: Receivers, processors, and exporters.

Receivers
Receivers are used to get data into the collector. Currently, the collector supports over forty different types of receivers. You can use the receivers to configure ports and formats the collector can take data in. It could be push or pull-based.
You can receive data in multiple formats. It has a default OTLP format, but you can receive data in other popular open-source formats like Jaeger or Prometheus.
Processors
Processors are used to do any processing required on the collected data, like data massaging, data manipulation, or any change in the data as it flows through the collector. It can also be used to remove PII data from the collected telemetry data, which can be very useful.
You can also do things like batching the data before sending it out, retrying in case the exporting fails, adding metadata, tail-based sampling, etc.
Exporters
Exporters are used to export data to an observability backend like SigNoz. You can send out data in multiple data formats. You can send different telemetry signals to different backend analysis tools. For example, you can send traces to Jaeger and metrics to Prometheus.
With the combination of these three components, OpenTelemetry Collector can be used to build data pipelines. Pipelines are configured via a YAML configuration file easily. This provides flexibility to teams managing their telemetry data.
How to configure a OpenTelemetry collector?
You need to configure the three components of the OpenTelemetry collector described above. Once configured, these components must be enabled via pipelines within the service section. SigNoz comes with an OpenTelemetry collector installed. You can find the configuration file of SigNoz OpenTelemetry collector here.
Configuring Receivers
In the sample code shown below, we have two receivers:
- OTLP Default OpenTelemetry protocol to transfer telemetry data. SigNoz receives telemetry data in OTLP format.
- Jaeger You can also receive traces data in Jaeger format, which is a popular distributed tracing tool.
receivers:
      otlp:
        protocols:
          grpc:
          http:
      jaeger:
        protocols:
          grpc:
          thrift_http:
Configuring Processors
There are three processors in the code sample shown below:
Batch
Batching helps better compress the data and reduce the number of outgoing connections required to transmit the data. This processor supports both size and time-based batching.Memory limiter
The memory limiter processor is used to prevent out-of-memory situations on the collector. Given that the amount and type of data a collector processes are environment-specific and resource utilization of the collector is also dependent on the configured processors, it is important to put checks in place regarding memory usage.Queued retry
This processor is highly recommended to configure for every collector as it minimizes the likelihood of data being dropped due to delays in processing or issues exporting the data.
processors:
      batch:
        send_batch_size: 1000
        timeout: 10s
      memory_limiter:
        # Same as --mem-ballast-size-mib CLI argument
        ballast_size_mib: 683
        # 80% of maximum memory up to 2G
        limit_mib: 1500
        # 25% of limit up to 2G
        spike_limit_mib: 512
        check_interval: 5s
      queued_retry:
        num_workers: 4
        queue_size: 100
        retry_on_failure: true
You can find detailed information about these processors and more in OpenTelemetry Collector GitHub repo.
Configuring Exporters
In this sample code, we have created two exporters.
kafka/traces
This forwards collected traces to write to a kafka topic named asotlp_spans.kafka/metrics
This forwards collected metrics to write to a kafka topic named asotlp_metrics.
exporters:
      kafka/traces:
        brokers:
          - signoz-kafka:9092
        topic: 'otlp_spans'
        protocol_version: 2.0.0
      kafka/metrics:
        brokers:
          - signoz-kafka:9092
        topic: 'otlp_metrics'
        protocol_version: 2.0.0
You can also configure extensions that enable things like monitoring the health of OpenTelemetry Collector.
Extensions
Extensions provide capabilities on top of the primary functionality of the OpenTelemetry Collector.
In this example, we have enabled two extensions.
Health Check
It enables a URL that can be used to check the status of the OpenTelemetry Collector.Zpages
It enables an HTTP endpoint that provides live data for debugging different components of the OpenTelemetry Collector.
extensions:
      health_check: {}
      zpages: {}
Configuring the service section and data pipelines
All the components that are configured must be enabled via pipelines within the service section. If a component is not defined in the service section, then it is not enabled. Pipelines make OpenTelemetry collector a must-have component in your architecture. It provides the flexibility of receiving and exporting data in multiple formats.
In the example shown below from SigNoz OTel Collector config file, we have enabled two pipelines.
traces
In this pipeline, we can receive traces injaegerandotlpformats. We then use three processors on the collected traces, namelysignozspanmetrics/prometheusandbatch. We export the processed traces to write to in ClickHouse DB.metrics
In the pipeline, we receive metrics inotlpformats. Process the collected metrics using batch processor and then export the processed metrics to ClickHouse.
service:
      extensions: [health_check, zpages]
      pipelines:
        traces:
          receivers: [jaeger, otlp]
          processors: [signozspanmetrics/prometheus, batch]
          exporters: [clickhousetraces]
        metrics:
          receivers: [otlp]
          processors: [batch]
          exporters: [clickhousemetricswrite]
A sample OpenTelemetry Collector configuration file. (Source: SigNoz)
receivers:
  filelog/dockercontainers:
    include: [  "/var/lib/docker/containers/*/*.log" ]
    start_at: end
    include_file_path: true
    include_file_name: false
    operators:
    - type: json_parser
      id: parser-docker
      output: extract_metadata_from_filepath
      timestamp:
        parse_from: attributes.time
        layout: '%Y-%m-%dT%H:%M:%S.%LZ'
    - type: regex_parser
      id: extract_metadata_from_filepath
      regex: '^.*containers/(?P<container_id>[^_]+)/.*log$'
      parse_from: attributes["log.file.path"]
      output: parse_body
    - type: move
      id: parse_body
      from: attributes.log
      to: body
      output: time
    - type: remove
      id: time
      field: attributes.time
  opencensus:
    endpoint: 0.0.0.0:55678
  otlp/spanmetrics:
    protocols:
      grpc:
        endpoint: localhost:12345
  otlp:
    protocols:
      grpc:
        endpoint: 0.0.0.0:4317
      http:
        endpoint: 0.0.0.0:4318
  jaeger:
    protocols:
      grpc:
        endpoint: 0.0.0.0:14250
      thrift_http:
        endpoint: 0.0.0.0:14268
      # thrift_compact:
      #   endpoint: 0.0.0.0:6831
      # thrift_binary:
      #   endpoint: 0.0.0.0:6832
  hostmetrics:
    collection_interval: 60s
    scrapers:
      cpu: {}
      load: {}
      memory: {}
      disk: {}
      filesystem: {}
      network: {}

processors:
  batch:
    send_batch_size: 10000
    send_batch_max_size: 11000
    timeout: 10s
  signozspanmetrics/prometheus:
    metrics_exporter: prometheus
    latency_histogram_buckets: [100us, 1ms, 2ms, 6ms, 10ms, 50ms, 100ms, 250ms, 500ms, 1000ms, 1400ms, 2000ms, 5s, 10s, 20s, 40s, 60s ]
    dimensions_cache_size: 10000
    dimensions:
      - name: service.namespace
        default: default
      - name: deployment.environment
        default: default

  resourcedetection:
    # Using OTEL_RESOURCE_ATTRIBUTES envvar, env detector adds custom labels.
    detectors: [env, system] # include ec2 for AWS, gce for GCP and azure for Azure.
    timeout: 2s
    override: false

extensions:
  health_check:
    endpoint: 0.0.0.0:13133
  zpages:
    endpoint: 0.0.0.0:55679
  pprof:
    endpoint: 0.0.0.0:1777

exporters:
  clickhousetraces:
    datasource: tcp://clickhouse:9000/?database=signoz_traces
  clickhousemetricswrite:
    endpoint: tcp://clickhouse:9000/?database=signoz_metrics
    resource_to_telemetry_conversion:
      enabled: true
  prometheus:
    endpoint: 0.0.0.0:8889
  # logging: {}

  clickhouselogsexporter:
    dsn: tcp://clickhouse:9000/
    timeout: 5s
    sending_queue:
      queue_size: 100
    retry_on_failure:
      enabled: true
      initial_interval: 5s
      max_interval: 30s
      max_elapsed_time: 300s

service:
  telemetry:
    metrics:
      address: 0.0.0.0:8888
  extensions:
    - health_check
    - zpages
    - pprof
  pipelines:
    traces:
      receivers: [jaeger, otlp]
      processors: [signozspanmetrics/prometheus, batch]
      exporters: [clickhousetraces]
    metrics:
      receivers: [otlp]
      processors: [batch]
      exporters: [clickhousemetricswrite]
    metrics/hostmetrics:
      receivers: [hostmetrics]
      processors: [resourcedetection, batch]
      exporters: [clickhousemetricswrite]
    metrics/spanmetrics:
      receivers: [otlp/spanmetrics]
      exporters: [prometheus]
    logs:
      receivers: [otlp, filelog/dockercontainers]
      processors: [batch]
      exporters: [clickhouselogsexporter]
Getting started with OpenTelemetry
OpenTelemetry provides a vendor-agnostic way of collecting and managing telemetry data. The next step is to choose a backend analysis tool that can help you make sense of the collected data. SigNoz is a full-stack open-source application performance monitoring and observability platform built natively for OpenTelemetry.
You can get started with SigNoz using just three commands at your terminal.
git clone -b main https://github.com/SigNoz/signoz.git
cd signoz/deploy/
./install.sh
For detailed instructions, you can visit our documentation.

SigNoz can be used to visualize metrics and traces with charts that can enable quick insights for your teams.

You can try out SigNoz by visiting its GitHub repo 👇
Related Content
OpenTelemetry Tracing - things you need to know
Monitor Nodejs Application with OpenTelemetry and SigNoz


Top comments (2)
Good job. This article is fantastic. Keep up being awesome. 💪
Thanks Meysam! :)