We have for the past four years used a third party for monitoring and alerting of our large scale serverless ecommerce platform.
For a number of reasons, we have recently decided to leave this provider in favour of CloudWatch.
This post will take you through how we used my two favourite AWS services, EventBridge and StepFunctions, to set up error anomaly detection for 100% of our Lambda functions along with context rich Slack alerts in less than two days. This model supports any resource type and alarm type, but for brevity I will focus on error anomaly alarms for Lambda.
Some understanding of both EventBridge and StepFunctions is assumed.
One thing we lacked with the third party solution was a coupling with CloudFormation stacks. Monitors were created by hand and if something was removed on the AWS side we were left with an orphaned monitor.
Being obsessed with automation, we needed a fast way to onboard all core resources to being monitored by CloudWatch. As a first approach we build cfn-alarms, a CLI tool to generate CloudFormation alarm and alerting boilerplate resources based on the resources in a template, but to roll that out on hundreds of stacks proved inefficient. However, we still wanted to tie the alarms with the lifecycle of the resources they monitor so that when a Lambda function is deleted, the associated alarms are deleted with it.
Loosely coupled alarms
At first we looked at what we require our teams to monitor when they deploy features to our platform. We came up with a quite small list of services including Lambda errors, SQS queue depth, API 5XX/4XX rate, etc.
When new resources are created or deleted, CloudTrail emits events to EventBridge's default bus with the configuration of the resource. To create or delete alarms we can simply create rules to match these events and route them to Lambda functions that programmatically spin them up or down:
  LambdaCreation:
    Type: AWS::Serverless::Function
    Properties:
      CodeUri: ./src
      Handler: lambda/creation.handler
      Events:
        LambdaCreationEvent:
          Type: EventBridgeRule
          Properties:
            InputPath: $.detail.requestParameters
            EventBusName: default
            Pattern:
              source:
                - aws.lambda
              detail-type:
                - AWS API Call via CloudTrail
              detail:
                eventName:
                  - prefix: CreateFunction
    [...]
This rule will forward the CloudTrail event's requestParameters to the function handler, which looks like this (truncated for brevity. Refer to the SDK docs for syntax):
exports.handler = async (event) => {
  const functionName = event.functionName;
  const tags = event.tags;

  const threshold = tags["alarm:lambda:errors:anomaly:threshold"] || 2;

  await cloudWatch
    .putAnomalyDetector({
        ... truncated ...
    })
    .promise();

  await cloudWatch
    .putMetricAlarm({
      AlarmName: `auto:${functionName}:lambda:errors:anomaly`,
      AlarmDescription: `Error anomaly detected`,
      Tags: Object.keys(tags).map((p) => {
        return { Key: p, Value: tags[p] };
      }),
      ... truncated ...
    })
    .promise();
};
Note how we allow for customisation of certain alarm configurations by using a tagging strategy of alarm:<service>:<metric>:<evaluation type>:<variable>. This naming is reflected in the AlarmName property for a semantic coupling. Also note how we relay the tags from the monitored resource onto the alarm resource. This will later be used in the alerting phase when monitors go in and out of alarm.
The alarm lifecycle event flow is very simple and looks like this:
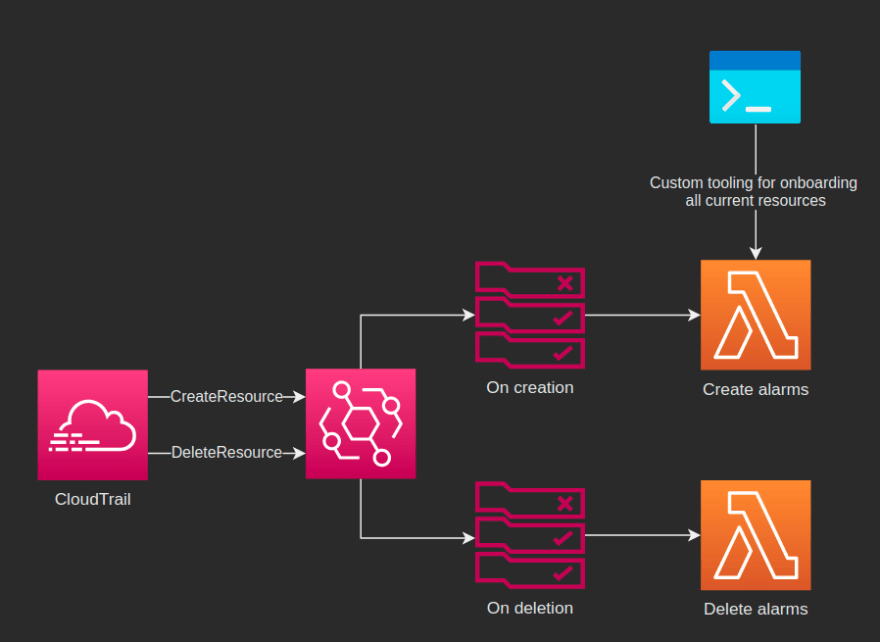
This approach also allows us to build custom tooling to onboard or reconfigure the entire platform in one go without the need of deploying all stacks.
Alerting
Getting alerting right is difficult and is a balance act of not skipping valuable alerts, but at the same time keeping it brief and relevant to avoid alarm fatigue.
At Mathem we use Slack across all development teams and we have a requirement to tag all resources with the team name owning the service. We wanted to leverage this to automatically direct alerts to team specific Slack channels. This is why we relay the resource tags on the alarm resource in the code example above.
When a CloudWatch alarm changes state there's an event put on EventBridge. A state can be one of OK, ALARM and INSUFFICIENT_DATA. We are interested in alerting on ALARM and communicating recovery on OK. The aim is to be as brief as possible whilst giving the developers quick access to extended context, such as logs and CloudWatch metrics related to the alarm. For this we'll use a StepFunctions state machine triggered by an EventBridge rule:
source:
  - aws.cloudwatch
detail-type:
  - CloudWatch Alarm State Change
detail:
  state:
    value:
      - ALARM
      - OK
resources:
  - prefix: !Sub >-
      arn:aws:cloudwatch:${AWS::Region}:${AWS::AccountId}:alarm:auto:
Note the prefix matching on the alarm ARN. Including auto: at the end ensures only automatically created alarms are consumed by the state machine.
The state machine takes different actions depending on the alarm state and resource type the alarm is concerning.
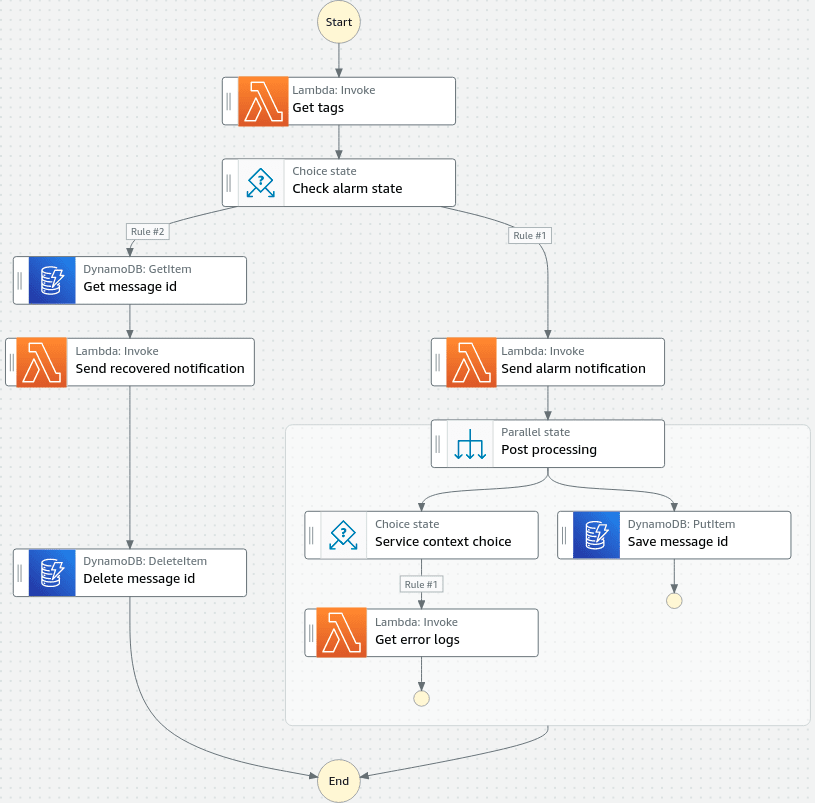
The first state simply fetches the tags from the alarm resource. The tags we are interested in are team, aws:cloudformation:stack-name and aws:cloudformation:logical-id. The team tag decides where to send the alert and the aws:cloudformation:... tags are used to make the alert message more human readable.
Next, we check if it's an alarm or a recovery. If it's an alarm we'll send a message to a Slack channel following #alerts-<teamname>-<environment>. If the channel doesn't exist, our Slack bot creates it for us.
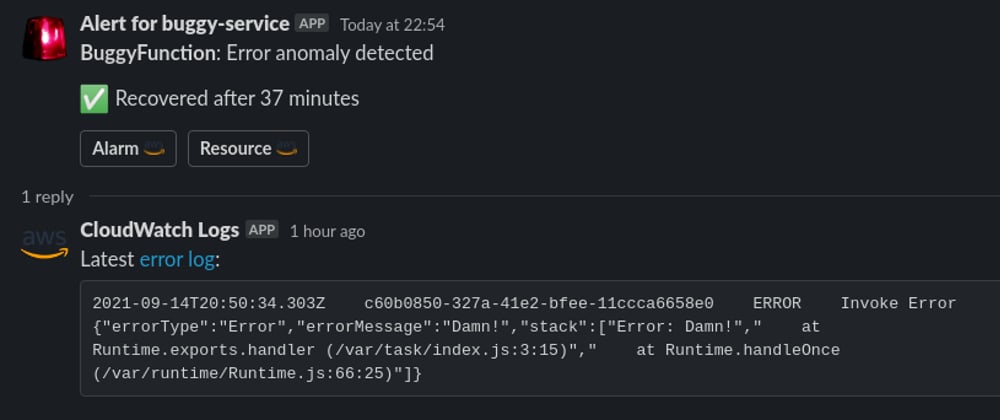
The alert is short and to the point. It also provides the developer buttons that instantly takes them to either the alarm page or the failing resource's page in the AWS console. This saves us from wasting time manually clicking our way to the root cause.

After the message is sent we pass the output to a parallel state. In one branch we store the message id, or timestamp, we get back from Slack to a DynamoDB table. We'll retrieve this when the alarm has recovered to update the original message.
The other branch in the parallel state allow us to extend the alarm notification with additional context depending on the resource type we're notifying about. At this point in time we have only implemented extra context for Lambda error alarms for which we fetch the most recent error log and post it as a thread reply along with a link to the log group:
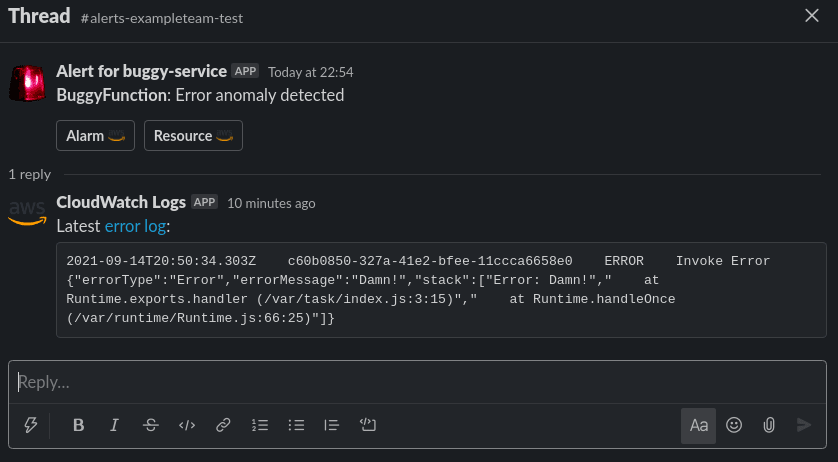
This can be extended with for example X-Ray data or whatever might be useful without flooding the channel.
When an alarm reach an OK state we update the original alarm instead of posting a new message.

Summary
This post covered an approach using EventBridge and Lambda to onboard a large set of resources to be monitored by CloudWatch Alarms and StepFunctions to create contextual Slack alerts that can easily be extended to other notification channels.
You can find a reference project for this post here. The state of the project is early days and be mindful of CloudWatch Alarm costs before deploying.


Top comments (2)
Loved it
Awesome! Thanks for such a detailed description.