AWS Cloud Operations & Migrations Blog
How to integrate Amazon Managed Service for Prometheus with Slack
Amazon Managed Service for Prometheus is a serverless Prometheus-compatible monitoring service for metrics to securely monitor container environments at scale. Amazon Managed Service for Prometheus lets you utilize open source Prometheus query language (PromQL) to monitor containerized workload performance without having to manage the underlying infrastructure required for the ingestion, storage, alerting, and querying of operational metrics. Amazon Managed Service for Prometheus automatically scales with your workloads, and it is integrated with AWS security services to allow fast and secure data access. Collect Prometheus metrics from Amazon Elastic Kubernetes Service (Amazon EKS) and Amazon Elastic Container Service (Amazon ECS) environments by utilizing AWS Distro for OpenTelemetry or Prometheus servers as collection agents.
Slack is a business communication platform offering persistent chat rooms (channels) organized by topic, private groups, and direct messaging. Many of our customers want to quickly alert a Slack channel when Amazon Managed Service for Prometheus detects customer-impacting performance issues with critical applications. This post provides you with prescriptive guidance on configuring Amazon Managed Service for Prometheus Alert Manager to publish alerts to a Slack channel using Amazon Simple Notification Service (SNS) and AWS Lambda.
Solution Overview
The following screenshot illustrates a high-level solution overview.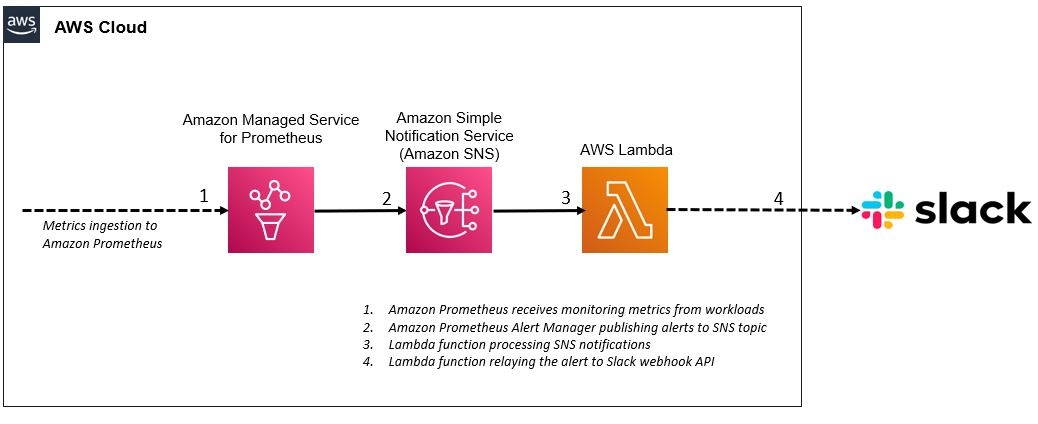
Figure 1: Solution overview
For this walk through, you will need the following:
- AWS account
- AWS IAM user or role with appropriate permission
- Amazon Managed Service for Prometheus
- Amazon Simple Notification Service (SNS)
- AWS Lambda
- Slack channel
Walk-through
At a high level, the steps here can be summarized as follows:
• Create an Amazon Managed Service for Prometheus Alert Manager definition to publish alerts to an SNS topic.
• Create a Lambda function that parses the SNS message and relays to the Slack webhook API.
• Setup Lambda function as a target for messages sent to the SNS topic.
Create SNS topic
An Amazon SNS topic is a logical access point acting as a communication channel. A topic lets you group multiple endpoints (such as AWS Lambda, Amazon SQS, HTTP/S, or an email address). The first and most common Amazon SNS task is creating a topic. Utilize the AWS Management Console or the AWS SDK to create a topic. Follow the steps in the AWS Well-Architected lab and create a topic. Have the SNS topic ARN ready in order to complete the next step.
Create Amazon Managed Service for Prometheus Alert Manager definition
Alert Manager handles alerts sent by firing alerting rules that are being run by Amazon Managed Service for Prometheus. It handles deduplicating, grouping, and routing alerts to the downstream receivers, such as Amazon SNS. It also handles alert silencing and inhibition. You can upload an Alert Manager definition via AWS CLI or AWS Management Console. The following is a sample SNS receiver configuration containing the SNS receiver configuration for Slack.
Using the following AWS CLI command, you can upload an Alert Manager configuration to a workspace.
aws amp create-alert-manager-definition --data file://<path to base64-encoded file> --workspace-id <workspace_id> --region <region>As well, you can update an Alert manager definition via the AWS Management Console. The following screenshot illustrates how to add definition from Amazon Managed Service for Prometheus workspace.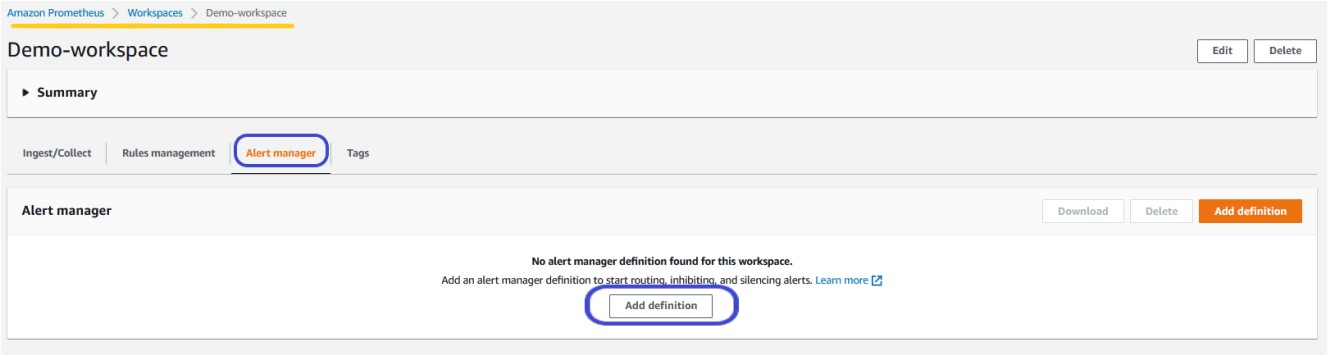
Figure 2: Amazon Managed Service for Prometheus workspace
The following screenshot illustrates an ‘active’ Alter manager definition once it is successfully added.
Figure 3: Amazon Managed Service for Prometheus Alert Manager definition
You must give Amazon Managed Service for Prometheus permission to send messages to your Amazon SNS topic. Refer to this document to learn how to create the access policy.
Create Slack Webhook
Incoming Webhooks are a simple way to post messages into Slack from apps. Creating an Incoming Webhook provides a unique URL to which you send a JSON payload with the message text and additional options. Utilize every usual formatting and layout block with Incoming Webhooks to make the messages stand out. Create your Slack webhook by following the instructions here. The generated webhook should be treated similarly to a set of credentials, and it should not be posted to a code repository or shared publicly.
Create Lambda function
We will now create a Lambda function that will conduct the following actions.
- Unwrap the yaml body of the SNS message and convert it to JSON.
- Pass the JSON contents of the SNS message to the Slack webhook API.
Lambda Function execution role
A Lambda function’s execution role is an AWS Identity and Access Management (IAM) role that grants the function permission to access AWS services and resources. Provide this role when you create a function, and Lambda assumes the role when your function is invoked. It’s good practice to enable logging of your serverless Lambda functions. AWS managed role AWSLambdaBasicExecutionRole provides permission to upload logs to CloudWatch.
This function uses the PyYAML library, so in order to make the library available within a Lambda function, you must create the deployment package with dependencies. Using the Lambda console, create the following Lambda function:
#!/usr/bin/python3.6
import urllib3
import json
import yaml
http = urllib3.PoolManager()
def lambda_handler(event, context):
    url = "<webhook_url>"
    msg = yaml.safe_load(event['Records'][0]['Sns']['Message'])
    encoded_msg = json.dumps(msg).encode('utf-8')
    resp = http.request('POST',url, body=encoded_msg)
    print({
        "SNS": event['Records'][0]['Sns'],
        "message": event['Records'][0]['Sns']['Message'],
        "status_code": resp.status,
        "response": resp.data
    })
When a message is published to the SNS topic that has a Lambda function subscribed to it, the Lambda function is invoked with the published message payload. The Lambda function receives this message payload as an input parameter, and then it sends the message to Slack webhook API. Refer to this blog to learn how to invoke AWS Lambda functions via Amazon SNS.
Validation
Customers can now setup Slack as a notification channel for Amazon Managed Service for Prometheus alerts. The following screenshot is an alert that Amazon Managed Service for Prometheus published to the Slack channel.

Figure 4: Amazon Managed Service for Prometheus alert published to the Slack channel.
Conclusion
This post provided prescriptive guidance and automation steps for enabling Alert manager to publish alerts to a Slack channel via Amazon Simple Notification Service (SNS) and AWS Lambda, and all of this without any performance impact or operational overhead. Companies of any size can adopt this proactive event management approach as part of the broader Cloud observability strategy.
Amazon Managed Service for Prometheus can be accessed via AWS Management Console, AWS Command Line Interface (CLI), in addition to the AWS SDKs. Amazon Managed Service for Prometheus lets you pay only for what you use, based on the metrics ingested, queried, and stored. You will be charged at the end of the month for your usage. For more information, please refer to AWS Well-Architected Framework and Architecture Best Practices for Management & Governance. We are here to help, and if you need further assistance in Cloud monitoring and observability strategy, then please reach out to AWS Support and your AWS account team.